Technical Indicator
Posted On: February 8, 2024
Support and Resistance: A Fundamental For Trading
Introduction:
Support and resistance are fundamental concepts in technical analysis and its part of technical indicator , providing valuable insights into price movements, trend reversals, and potential entry or exit points. This comprehensive guide explores the key aspects of support and resistance, their significance in market analysis, and practical applications for traders and investors.
Key Takeaways:
- Definition and Purpose:
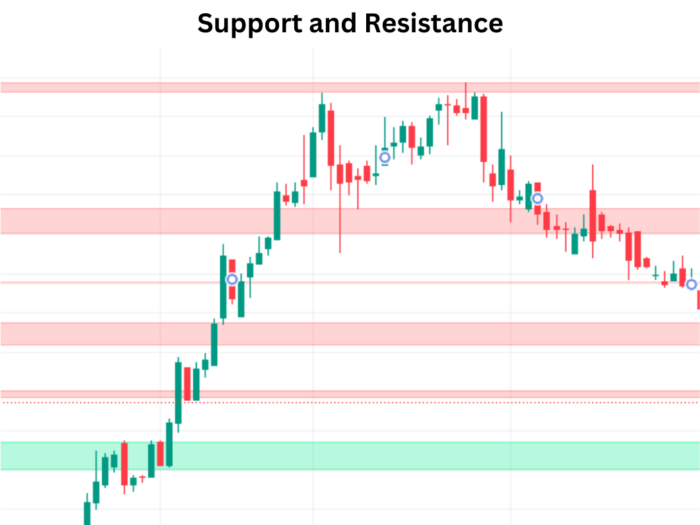
- Support and resistance levels are tools used by technical analysts to identify points on a chart where the likelihood of a pause or reversal in the prevailing trend is high.
- Support indicates where a downtrend may pause due to increased demand, while resistance marks where an uptrend may temporarily halt due to increased supply.
- Market Psychology and Behavior:
- Support and resistance levels reflect market psychology, as traders and investors respond to historical patterns and anticipate future market movements.
- These levels are identified using trendlines, moving averages, and areas on a price chart where supply and demand dynamics undergo a shift.
- Application in Trading:
- Support and resistance areas serve as potential entry or exit points for traders.
- Traders can make informed decisions based on the reaction of prices to these levels, either bouncing away or breaking through, leading to profitable or loss-limiting outcomes.
Understanding Support:
In Downtrends:
Prices fall in a downtrend due to excess supply. Support is the level where demand rises to match supply, causing prices to stop falling.
Support can be a specific price level or a zone, indicating buyers’ willingness to buy.
Understanding Resistance:
In Uptrends:
Prices rise in an uptrend due to excess demand. Resistance is the level where selling overwhelms buying, leading to a temporary halt or reversal.
Resistance can be a specific price level or a zone, reflecting a concentration of supply.
Timing and Trade Execution:
Entry and Exit Points:
- Traders use support and resistance levels as potential entry or exit points.
- Trades are timed based on the expectation that these levels will hold or be breached, allowing for quick decisions and risk management.
Basics of Support and Resistance:
- Timeframes and Significance:
- Support and resistance exist across various charting timeframes, from daily to weekly and monthly.
- Longer timeframes typically indicate more significant support or resistance levels.
- Flexibility in Interpretation:
- Technical analysis is not exact, and flexibility is required in interpreting support and resistance levels.
- Past levels may not always hold, requiring traders to adapt to changing market conditions.
Conclusion:
Support and resistance are foundational elements in technical analysis, providing traders and investors with valuable tools for understanding market dynamics. By mastering the identification and interpretation of these levels, market participants can enhance their ability to make informed decisions, manage risks, and navigate the complexities of financial markets. While support and resistance are not foolproof, their consistent application and integration into comprehensive trading strategies contribute to successful market navigation.
xCalData is an exceptional app available for Android devices that offers unbiased insights into stocks, allowing investors to make informed decisions. With its user-friendly interface and comprehensive features, xCalData provides a valuable resource for anyone interested in the stock market. Download the app from google play.
For Actionable Intelligence, subscribe to xCalData app on Android devices: https://tinyurl.com/downloadxCalData
Popular Posts
-
Stock of Interest . August 23, 2024
#HSCL (NSE) Stock Report | 23 Aug 2024
-
Stock of Interest . August 23, 2024
Add Zerodha trading account to xCalData
-
Stock of Interest . August 23, 2024
What is xCalData , how to use it and how accurate is it?
-
Stock of Interest . August 23, 2024
Jurik Moving Average (JMA): A Profit Trading Insight