Technical Indicator
Posted On: October 25, 2023
Technical Indicators: A Guide for Traders
In the world of trading, the use of technical indicators is pervasive. These tools are essential for analyzing market data and assisting traders in making informed decisions. They are instrumental in understanding market trends, price movements, and potential buy or sell opportunities. However, the world of technical indicators can be a labyrinth for newcomers and even some experienced traders. In this comprehensive guide, we will demystify technical indicators, exploring what they are, how they work, the different types, and their crucial role in making informed trading decisions.
What Are Technical Indicators?
Technical indicators are mathematical calculations or statistical measures based on the price, volume, or open interest of a security or a market. Traders use these indicators to gain insights into market conditions, identify trends, and make predictions about future price movements. These tools allow traders to analyze historical price data and patterns, aiding in making more informed decisions about when to enter or exit trades.
Types of Technical Indicators:
The universe of technical indicators is vast and varied, with each indicator serving a unique purpose. Here are some of the most commonly used types:
- Trend Indicators: These indicators help traders identify the prevailing trend in a market. Trend indicators are crucial because they allow traders to align their strategies with the dominant direction of price movements. Examples of trend indicators include Moving Averages, Average Directional Index (ADX), and Parabolic SAR.
- Momentum Indicators: Momentum indicators measure the speed and strength of price movements. They help traders gauge whether an asset is overbought or oversold and whether a trend is likely to continue or reverse. Popular momentum indicators include the Relative Strength Index (RSI), the Stochastic Oscillator, and the Moving Average Convergence Divergence (MACD).
- Volatility Indicators: Volatility indicators, as the name suggests, provide insights into market volatility. Understanding market volatility is crucial for risk management. Indicators like Bollinger Bands, Average True Range (ATR), and the VIX (Volatility Index) are commonly used to assess market volatility.
- Volume Indicators: Volume indicators analyze trading volume to gauge the strength of a trend. A significant price movement accompanied by high volume is often seen as more valid and sustainable than one with low volume. On-Balance Volume (OBV), Chaikin Money Flow, and Volume Weighted Average Price (VWAP) are some of the volume indicators used by traders.
- Oscillators: Oscillators help traders identify overbought or oversold conditions in the market. These indicators provide a numeric range within which an asset’s price oscillates. The Relative Strength Index (RSI), Moving Average Convergence Divergence (MACD), and the Commodity Channel Index (CCI) are popular oscillators used by traders.
How Technical Indicators Work
Technical indicators are essentially mathematical formulas applied to historical price and volume data. These calculations produce values that are plotted on charts. By interpreting these plotted values, traders gain insights into market conditions.
Here’s a brief overview of how some popular indicators work:
- Moving Averages: Moving averages smooth out price data over a specified period, creating a trend-following line. The two main types are Simple Moving Averages (SMA) and Exponential Moving Averages (EMA). Traders use moving averages to identify trends and potential reversal points. For example, a “golden cross” occurs when a short-term EMA crosses above a long-term EMA, suggesting a bullish trend.
- Relative Strength Index (RSI): RSI measures the magnitude of recent price changes to determine overbought or oversold conditions. It ranges from 0 to 100, with values above 70 indicating overbought and values below 30 indicating oversold. Traders often use the RSI to identify potential reversal points when it reaches extreme levels.
- Bollinger Bands: Bollinger Bands consist of a middle band (a simple moving average) and two outer bands representing standard deviations from the middle band. These bands expand and contract with market volatility. When the price approaches the upper band, it is considered overbought, while approaching the lower band suggests oversold conditions. Bollinger Bands help identify periods of high or low volatility.
Using Technical Indicators Effectively
While technical indicators are powerful tools, they are not foolproof. Here are some tips for using them effectively:
- Combine Multiple Indicators: Don’t rely on a single indicator in isolation. Combining multiple indicators can provide more comprehensive insights into market conditions. A common practice is to use a combination of a trend-following indicator (e.g., Moving Average) and a momentum oscillator (e.g., RSI).
- Understand Market Context: Technical indicators are most effective when used in conjunction with an understanding of the broader market context. Consider the impact of news events, economic data releases, and geopolitical factors that might influence price movements.
- Backtesting: Before using an indicator in real-time trading, it’s essential to backtest it using historical data. This allows traders to assess its effectiveness and fine-tune their strategy.
- Risk Management: Technical indicators are just one part of a trading strategy. Proper risk management is crucial. This includes setting stop-loss orders to limit potential losses and determining appropriate position sizes based on risk tolerance.
- Continuous Learning: The world of trading is dynamic, and what works today might not work tomorrow. Traders should continually educate themselves and adapt to changing market conditions.
Where can I Find Seasonality of the Stocks?
The Answer for your question is XCalData, In This Application you can find Technical Ratios, Seasonality, Historical Doubling Period, Stock Reports, Forecast, Strategies, Support and Resistance, Stop Loss, Trend, Target Price, Financial Ratios, and Many more.
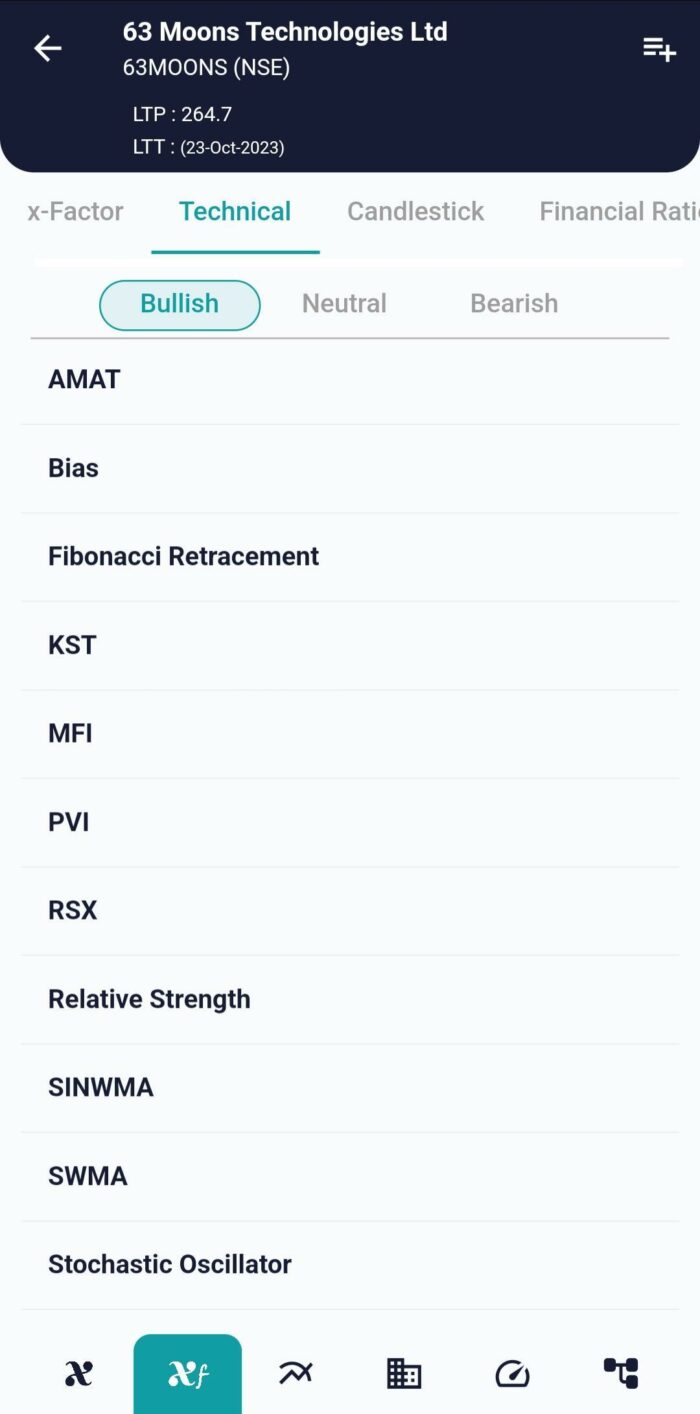
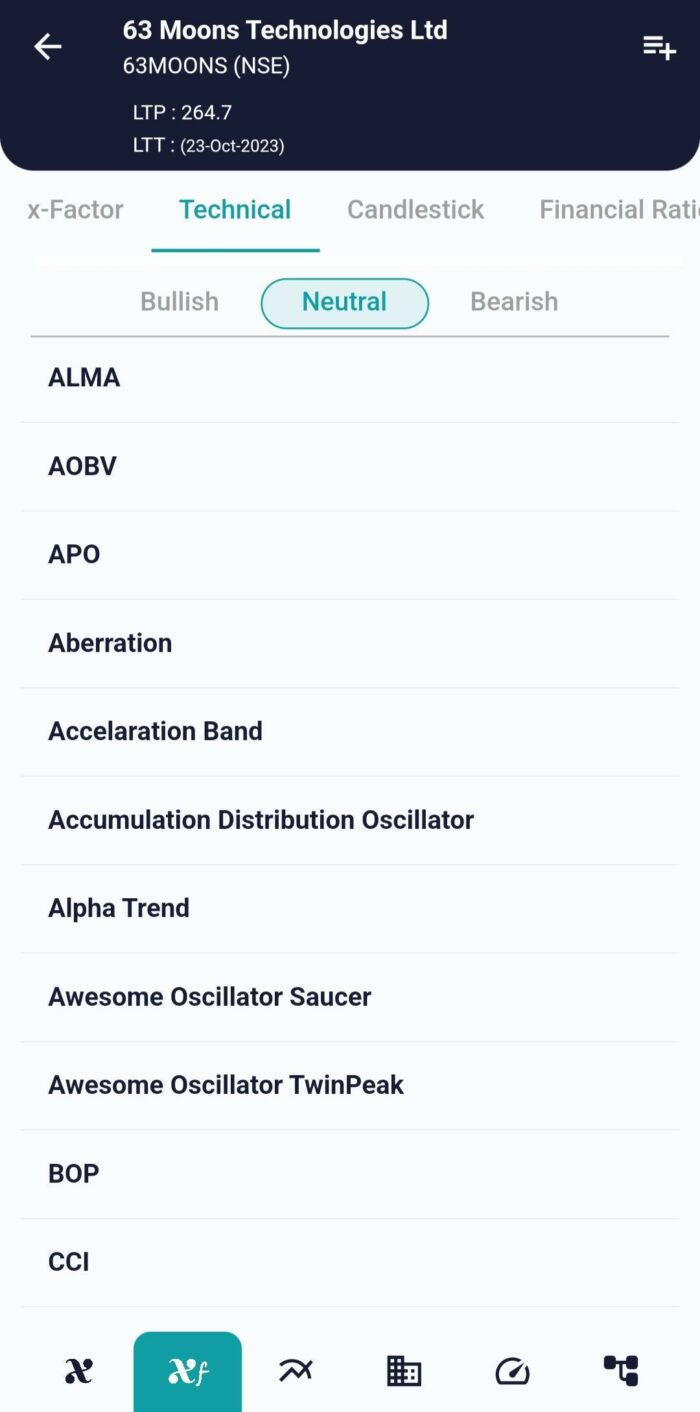
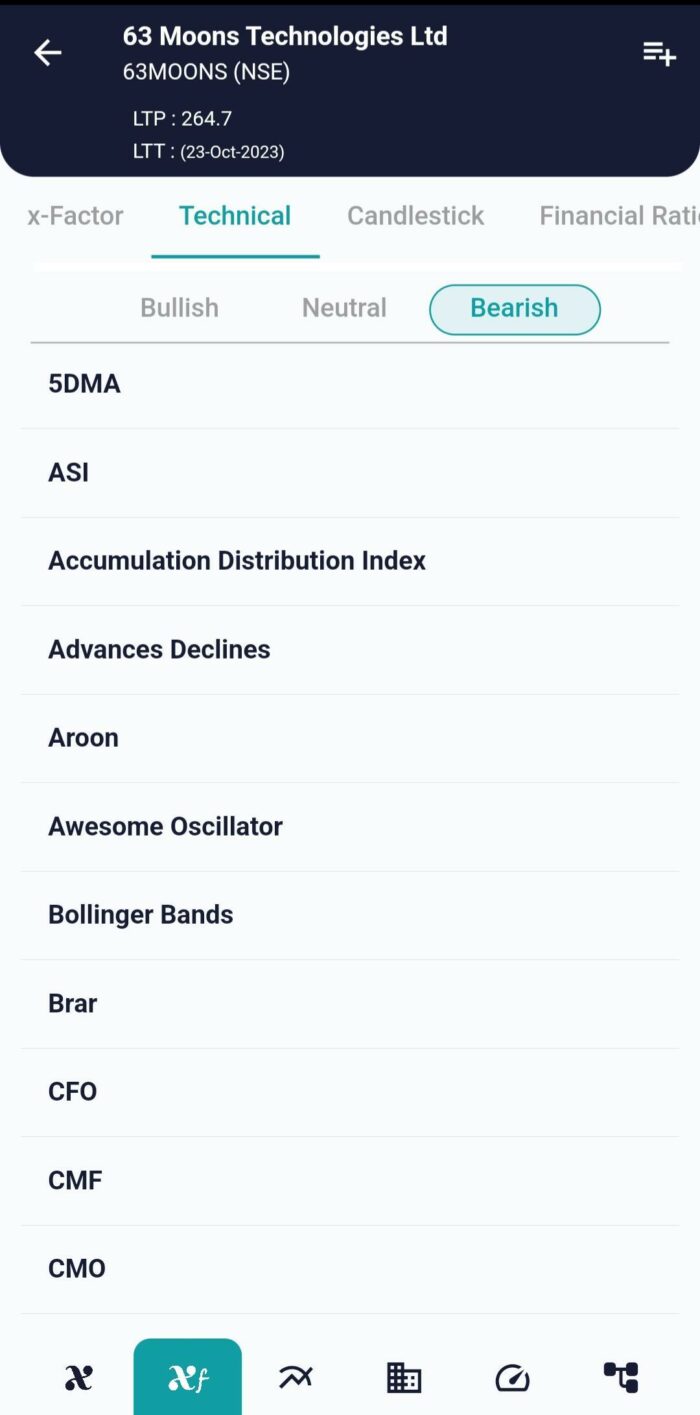
In XCalData, you can view technical indicators that interpret whether market conditions are bullish, bearish, or neutral.
Conclusion
Technical indicators are invaluable tools for traders, offering insights into market trends and potential entry and exit points. While they can be powerful, it’s crucial to understand their limitations and use them in conjunction with other forms of analysis, such as fundamental analysis and market sentiment. Ultimately, successful trading requires a combination of technical expertise, fundamental knowledge, and effective risk management. Mastery of technical indicators takes time, practice, and a commitment to continuous learning. It’s a journey that can lead to more informed, confident trading decisions and, hopefully, increased profitability in the financial markets. For Actionable Intelligence, subscribe to xCalData app on Android devices: https://tinyurl.com/downloadxCalData
Popular Posts
-
Stock of Interest . August 23, 2024
#HSCL (NSE) Stock Report | 23 Aug 2024
-
Stock of Interest . August 23, 2024
Add Zerodha trading account to xCalData
-
Stock of Interest . August 23, 2024
What is xCalData , how to use it and how accurate is it?
-
Stock of Interest . August 23, 2024
Jurik Moving Average (JMA): A Profit Trading Insight