Candlestick Pattern
Posted On: February 13, 2024
Three Inside Down Pattern: Navigating Bearish Reversals with Precision
In the intricate landscape of financial markets, traders utilize a diverse array of technical analysis tools to decipher potential trend reversals and market dynamics. Candlestick patterns, celebrated for their ability to provide actionable insights, play a pivotal role in this endeavor. The Three Inside Down pattern is one such candlestick formation that commands attention from traders, acting as a signal for potential bearish reversals. In this blog post, we will explore the concept of the Three Inside Down pattern, delve into its identification process, and discuss how traders can interpret this formation to refine their trading strategies.
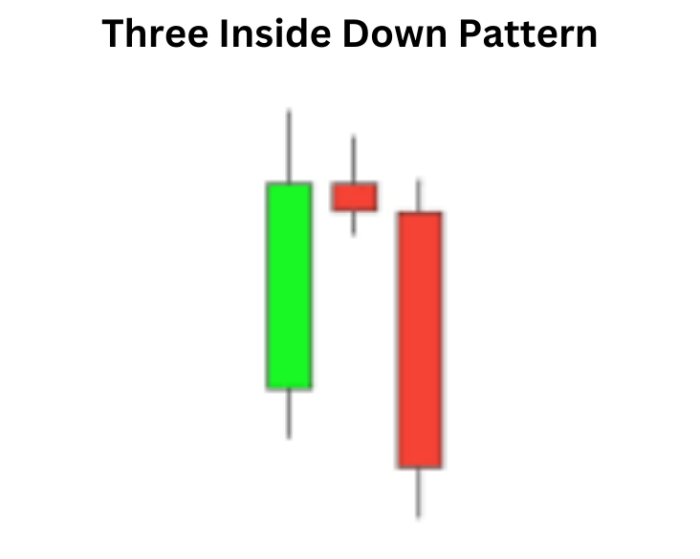
The Three Inside Down pattern is a three-candlestick formation that typically materializes at the end of an uptrend, indicating a potential reversal to the downside. The pattern consists of a large bullish candle, followed by a smaller bearish candle that is entirely engulfed by the real body of the preceding bullish candle, and finally, a larger bearish candle.
Identifying the Three Inside Down Pattern:
To identify the Three Inside Down pattern, traders should pay close attention to the following key features:
- Uptrend: The pattern usually emerges within an ongoing uptrend, signaling potential bearish reversal.
- Large Bullish Candle: The first candlestick is a large bullish candle, reflecting the prevailing buying pressure in the market.
- Smaller Bearish Candle: The second candlestick is a smaller bearish candle that is entirely engulfed by the real body of the preceding bullish candle.
- Another Larger Bearish Candle: The third candlestick is another larger bearish candle, indicating a potential continuation of the bearish reversal.
Interpreting the Three Inside Down Pattern:
The Three Inside Down pattern implies a significant shift in market sentiment from bullish to bearish. The smaller bearish candle within the real body of the preceding bullish candle acts as a signal of weakening bullish momentum. Traders interpret this pattern as a signal to consider initiating short positions or tightening stop-loss levels on existing long positions.
Confirmation and Trade Execution:
While the Three Inside Down pattern provides a potential reversal signal, traders often seek supplementary confirmation before entering trades. They may consider the following factors:
- Volume Confirmation: Higher trading volume during the pattern’s formation enhances the credibility of the potential reversal.
- Support and Resistance Levels: Identifying key support and resistance levels can further validate the pattern’s authenticity and guide in setting realistic price targets.
- Trend Analysis: Integrating the Three Inside Down pattern with broader trend analysis helps traders understand the context within which the pattern is occurring.
Conclusion:
The Three Inside Down pattern serves as a valuable tool for traders, offering insights into potential bearish reversals at the end of an uptrend. By understanding its identification process and adeptly interpreting this pattern, traders can refine their trading strategies.
However, it’s crucial to recognize that no pattern guarantees success, and informed trading decisions necessitate additional verification and comprehensive analysis. As with any trading strategy, risk management and prudent decision-making remain paramount for traders navigating the complexities of financial markets.
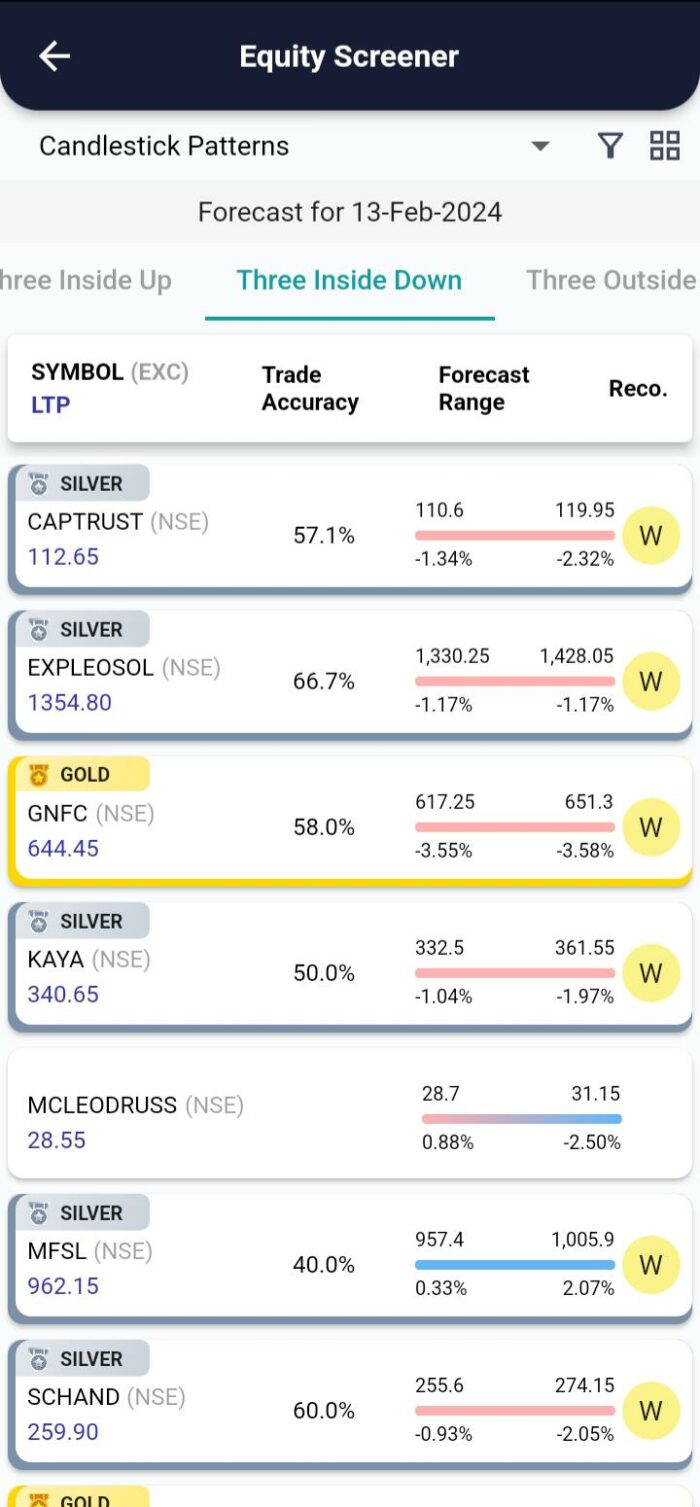
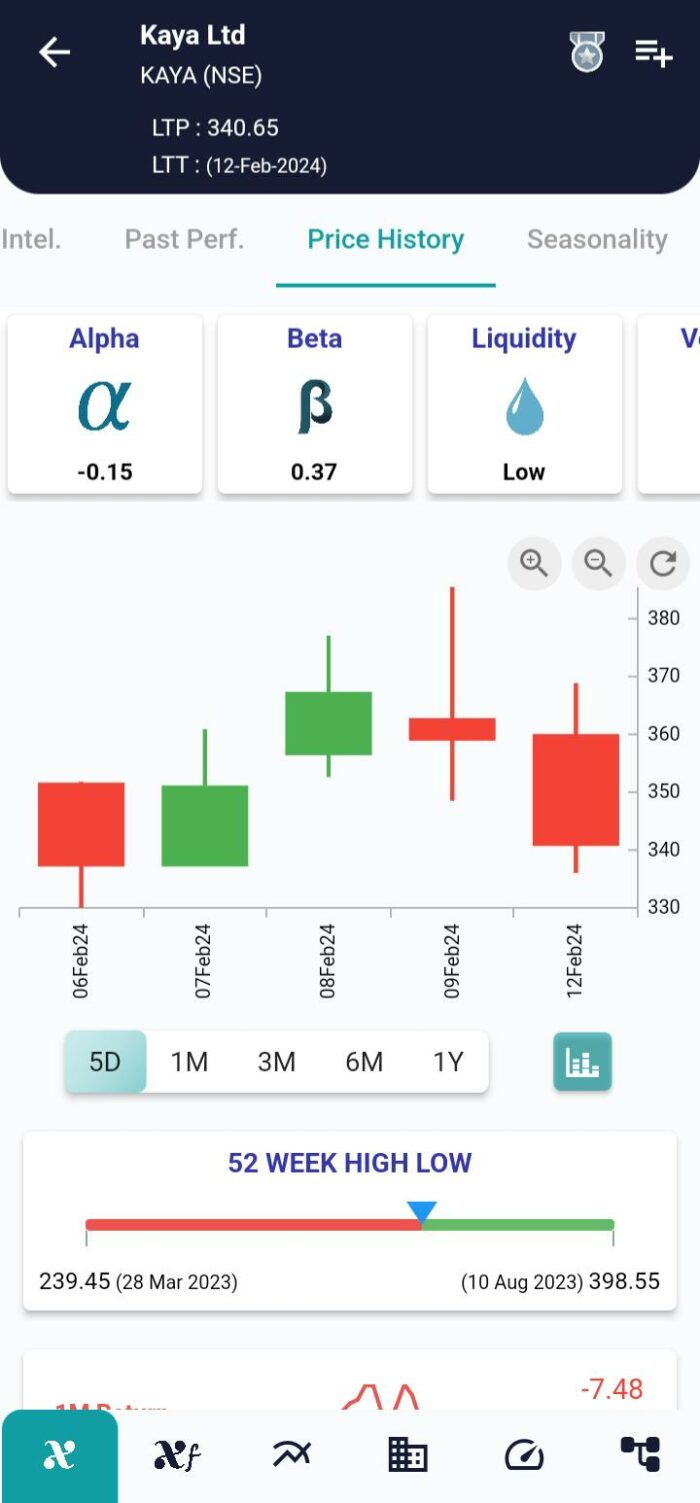
Where can I see further insights on this stock?
xCalData offers unbiased insights into stocks. Download the app from google play. For Actionable Intelligence, subscribe to xCalData app on Android devices: Download here
For Actionable Intelligence, subscribe to xCalData app on Android devices: https://tinyurl.com/downloadxCalData

Disclaimer: The securities quoted are for illustration only and are not recommendatory.
Popular Posts
-
Stock of Interest . August 23, 2024
#HSCL (NSE) Stock Report | 23 Aug 2024
-
Stock of Interest . August 23, 2024
Add Zerodha trading account to xCalData
-
Stock of Interest . August 23, 2024
What is xCalData , how to use it and how accurate is it?
-
Stock of Interest . August 23, 2024
Jurik Moving Average (JMA): A Profit Trading Insight