Technical Indicator
Posted On: January 31, 2024
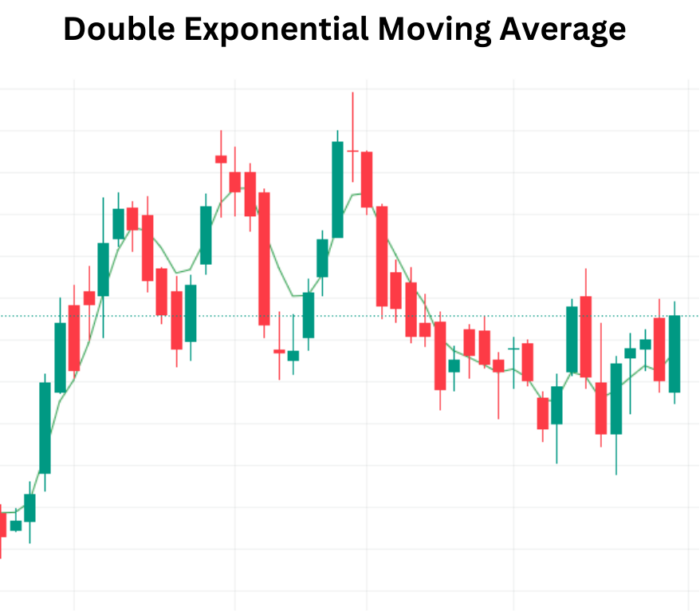
Trade with Success: Mastering Market Trends using Double Exponential Moving Average (DEMA)
Unveiling the Power of DEMA: A Lag-Reducing Marvel
In the dynamic realm of financial markets, where precision and timely insights are paramount, the Double Exponential Moving Average (DEMA) emerges as a formidable technical indicator . Crafted to mitigate lag and minimize noise in price charts, the DEMA is a go-to tool for traders seeking a clearer lens into market trends.
Diving into the Core: Understanding the DEMA Formula
The mathematical heartbeat of DEMA pulsates through the formula:
DEMA = 2 × EMAn − EMA of EMAn
Breaking it down:
EMAn: Represents the Exponential Moving Average with a look-back period of ‘n.’EMA of EMAn: Signifies the Exponential Moving Average of the calculated EMAn.2 × (EMAn − EMA of EMAn): Captures the essence of the double exponential smoothing.
Decoding DEMA: Unleashing Market Interpretation
- Trend Identification:
- Double Exponential Moving Average, akin to traditional moving averages, becomes a compass for identifying trends. An uptrend materializes when prices surge above the DEMA, while a downtrend unfolds when prices dip below.
- Reducing Lag:
- Lag reduction is the cornerstone of DEMA’s prowess. By employing two EMAs, it adeptly navigates market noise, providing traders with a more responsive and refined tool.
Navigating Trading Signals: Interpreting DEMA Dynamics
The interpretation of Double Exponential Moving Average unfurls through the interplay of ‘DEMA Value’ and ‘Close Price’:
- Buy Signal:
- If yesterday’s ‘DEMA Value’ surpasses yesterday’s Close Price and the current ‘DEMA Value’ equals or falls below the current ‘Adjusted Price,’ a “Buy” signal emerges.
- Sell Signal:
- Conversely, if yesterday’s ‘DEMA Value’ eclipses yesterday’s Close Price and the current ‘DEMA Value’ equals or exceeds the current Close Price , a “Sell” signal is triggered.
- Hold Signal:
- In the absence of the above conditions, signifying a neutral stance, the code assigns “Hold” to navigate a patient strategy.
Integrating DEMA into Trading Strategies: A Tactical Approach
- Trend Confirmation:
- Leverage Double Exponential Moving Average as a powerful ally to confirm existing trends, enabling traders to align their strategies with the prevailing market direction.
- Dynamic Entry and Exit Points:
- Double Exponential Moving Average responsiveness allows traders to pinpoint opportune moments for market entry and exit, fostering a dynamic and adaptive trading approach.
Conclusion: Empowering Traders with DEMA Precision
As traders navigate the complexities of financial markets, the Double Exponential Moving Average stands as a beacon of clarity, offering a lag-reducing lens into market trends. Its nuanced interpretation of price dynamics and timely signals empower traders to make informed decisions. Whether you’re a seasoned trader or a budding investor, embracing the Double Exponential Moving Average can elevate your trading acumen, ushering in a new era of precision and responsiveness in market analysis
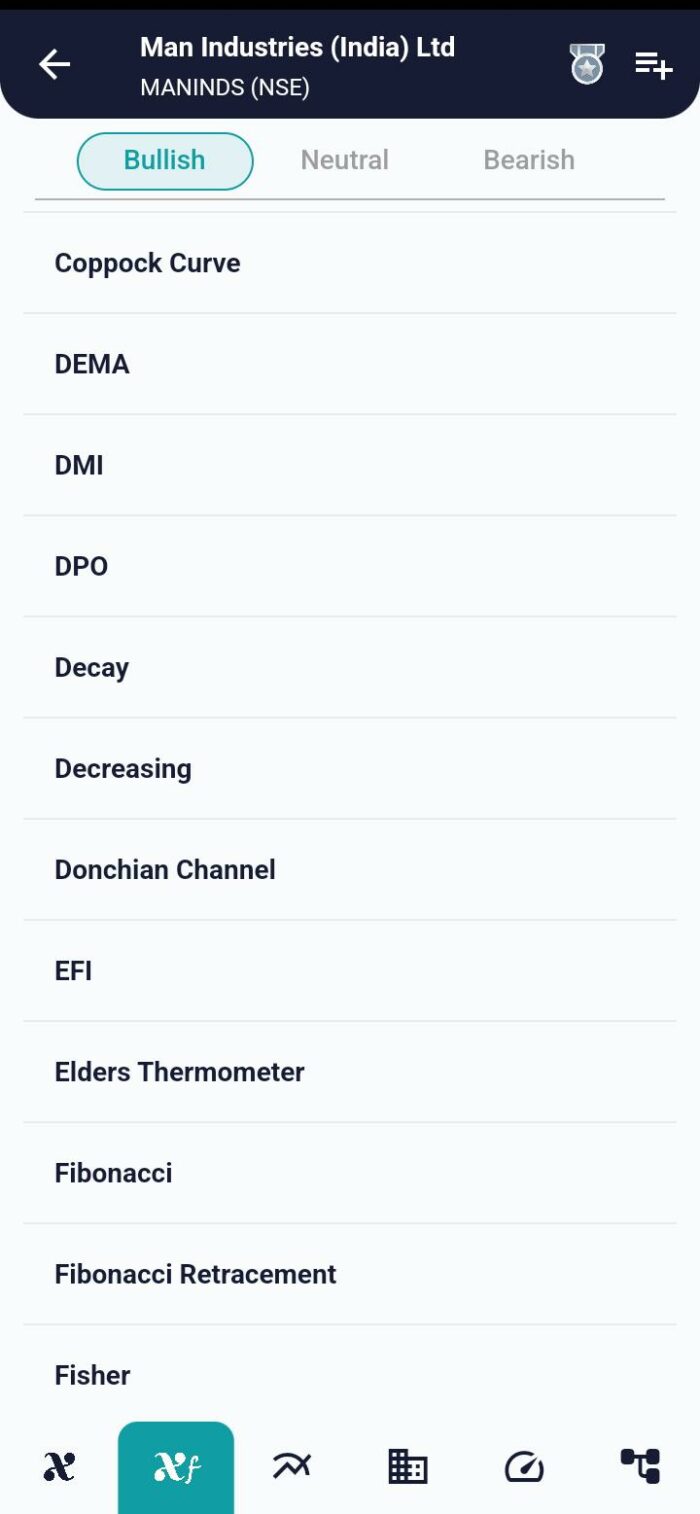
xCalData is an exceptional app available for Android devices that offers unbiased insights into stocks, allowing investors to make informed decisions. With its user-friendly interface and comprehensive features, xCalData provides a valuable resource for anyone interested in the stock market. Download the app from google play.
For Actionable Intelligence, subscribe to xCalData app on Android devices: https://tinyurl.com/downloadxCalData
.
Popular Posts
-
Stock of Interest . August 23, 2024
#HSCL (NSE) Stock Report | 23 Aug 2024
-
Stock of Interest . August 23, 2024
Add Zerodha trading account to xCalData
-
Stock of Interest . August 23, 2024
What is xCalData , how to use it and how accurate is it?
-
Stock of Interest . August 23, 2024
Jurik Moving Average (JMA): A Profit Trading Insight