Technical Indicator
Posted On: February 7, 2024
Relative Strength Index (RSI): Trading Secret With Success
Introduction:
The Relative Strength Index (RSI), created by J. Welles Wilder, stands as a prominent momentum oscillator in the realm of technical analysis. Offering insights into the speed and magnitude of price movements, the RSI oscillates between zero and 100. This comprehensive guide delves into the intricacies of the RSI, exploring its calculation, interpretation, and practical applications in navigating the dynamic landscape of financial markets.
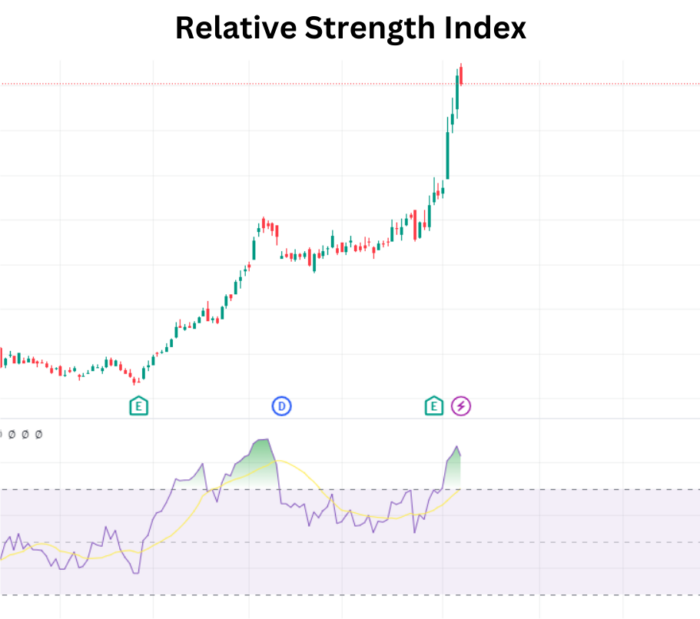
Understanding the Relative Strength Index (RSI):
The RSI is a versatile technical indicator designed to gauge the momentum of price changes. It provides traders with a numerical value that oscillates within a range of zero to 100, reflecting the relative strength of recent price gains compared to losses. Traditionally, the RSI is deemed overbought when it surpasses the 70 threshold and oversold when it falls below 30. These levels can be adjusted based on the security’s characteristics, with considerations for potential modifications, such as using 80 for overbought conditions.
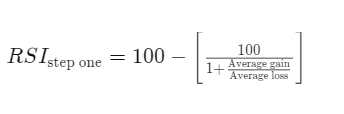
Calculation of the Relative Strength Index (RSI):
The Relative Strength Index is calculated through a multi-step process, involving the determination of average gains and losses over a specified period (commonly 14 periods).
The formula is as follows:
Interpreting Relative Strength Index (RSI) Values:
- Overbought Conditions:
- Traditionally, an Relative Strength Index reading above 70 indicates overbought conditions.
- Overbought implies that the asset may be due for a potential reversal or corrective pullback.
- Oversold Conditions:
- Conversely, an Relative Strength Index reading below 30 signifies oversold conditions.
- Oversold suggests that the asset may be poised for a potential rebound or upward correction.
- Adjustment for Security Characteristics:
- Traders may consider adjusting overbought and oversold levels based on the security’s behavior.
- If a security consistently reaches the overbought level, adjusting it to a higher threshold (e.g., 80) might be warranted.
- Extended Periods in Overbought or Oversold:
- Strong trends can lead to extended periods of overbought or oversold conditions.
- Traders should be cautious about relying solely on RSI signals during strong trends.
- Chart Patterns and Support/Resistance:
- RSI often forms chart patterns not evident in the price chart.
- Look for double tops, double bottoms, trend lines, and support/resistance levels on the RSI.
- Uptrend and Downtrend RSI Ranges:
- In an uptrend or bull market, RSI typically ranges between 40 to 90, with 40-50 acting as support.
- During a downtrend or bear market, RSI tends to stay between 10 to 60, with 50-60 acting as resistance.
Practical Considerations for Trading with RSI:
- Divergence and Convergence:
- Explore divergence or convergence between price movements and RSI for potential trend reversal signals.
- Adjustment of Settings:
- Experiment with different settings for RSI to align with the preferred trading strategy and the specific characteristics of the asset.
- Confirmation with Other Indicators:
- Combine RSI signals with other technical indicators to strengthen the overall trading strategy.
- Market Conditions:
- Consider prevailing market conditions, as RSI performance may vary in different market environments.
- Risk Management:
- Implement robust risk management practices, including setting stop-loss orders and managing position sizes.
Conclusion:
The Relative Strength Index (RSI) stands as a versatile tool for traders seeking to assess momentum and potential trend reversals in financial markets. By understanding the nuances of RSI interpretation, adjusting levels based on security characteristics, and integrating RSI signals with broader trading strategies, traders can harness the power of this oscillator for more informed decision-making.
As with any technical indicator, traders should approach RSI with a combination of theoretical knowledge, practical experience, and adaptability to changing market dynamics. Mastery of the RSI can empower traders to navigate diverse market conditions and make strategic decisions aligned with their financial goals.
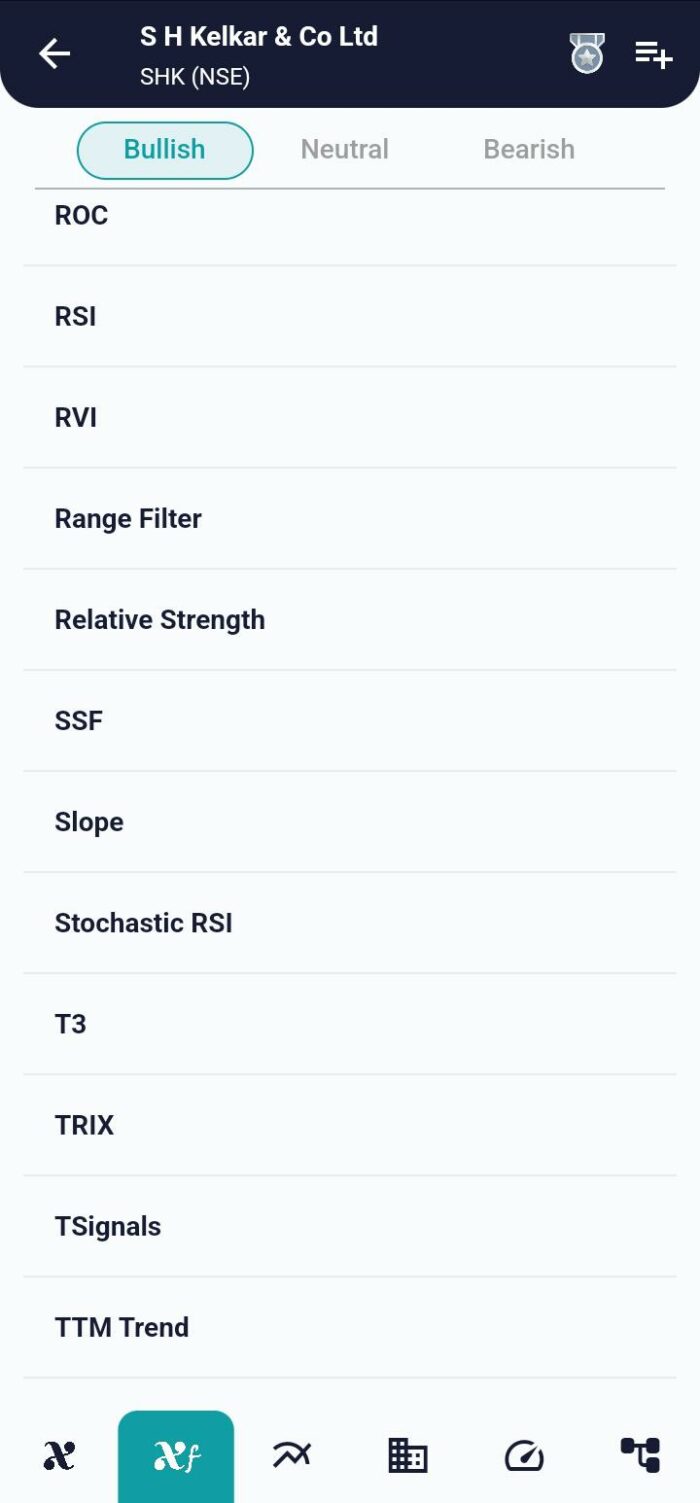
xCalData is an exceptional app available for Android devices that offers unbiased insights into stocks, allowing investors to make informed decisions. With its user-friendly interface and comprehensive features, xCalData provides a valuable resource for anyone interested in the stock market. Download the app from google play.
For Actionable Intelligence, subscribe to xCalData app on Android devices: https://tinyurl.com/downloadxCalData
Popular Posts
-
Stock of Interest . August 23, 2024
#HSCL (NSE) Stock Report | 23 Aug 2024
-
Stock of Interest . August 23, 2024
Add Zerodha trading account to xCalData
-
Stock of Interest . August 23, 2024
What is xCalData , how to use it and how accurate is it?
-
Stock of Interest . August 23, 2024
Jurik Moving Average (JMA): A Profit Trading Insight