Technical Indicator
Posted On: February 12, 2024
Trading Victory with Williams %R Indicator
Introduction:
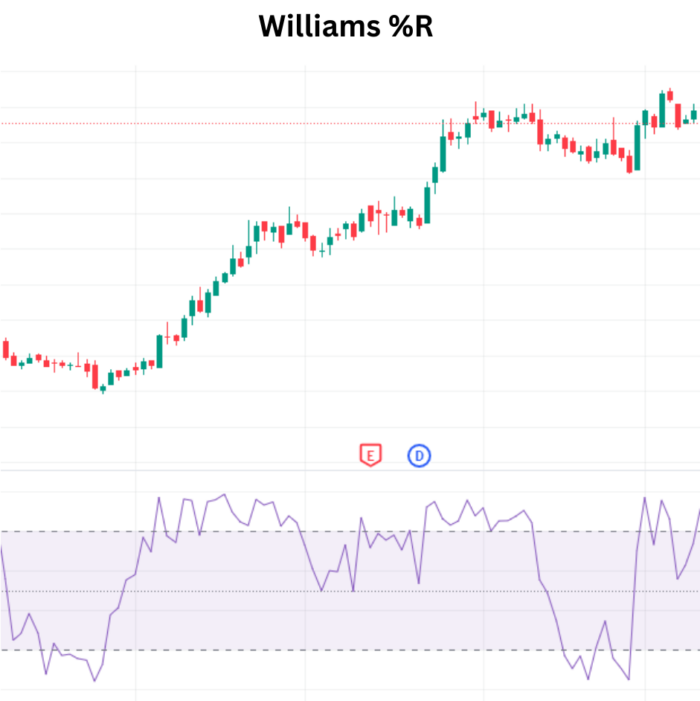
Larry Williams created the momentum technical indicator known as the Williams %R, or Williams Percent Range. This indicator, which runs from 0 to -100, is frequently used to pinpoint overbought and oversold market conditions. Williams %R is used to produce entry and exit signals based on price dynamics, much like the Stochastic oscillator. This indicator is often used by traders to identify possible reversal points and evaluate the strength of current trends.
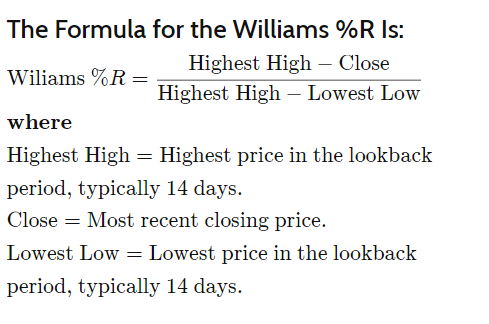
Calculation of Williams %R:
The formula for calculating Williams %R involves the following parameters over a specified lookback period, typically 14 days
Interpretation of Signals:
- Overbought Conditions:
- A reading above -20 indicates overbought conditions, suggesting that the price is near the upper end of its recent range.
- Overbought does not guarantee an immediate reversal; it signifies potential strength in the recent upward price movement.
- Oversold Conditions:
- Readings below -80 suggest oversold conditions, implying that the price is near the lower end of its recent range.
- Similar to overbought, oversold conditions do not guarantee an immediate reversal but indicate potential strength in the recent downward price movement.
Generating Trade Signals:
- Buy Signal:
- Traders may consider a buy signal when Williams %R falls below -80 during an uptrend and subsequently rises above -80. This could indicate a potential continuation of the uptrend.
- Sell Signal:
- Conversely, in a downtrend, a sell signal may emerge when Williams %R rises above -20 and then falls below -20. This could suggest a potential continuation of the downtrend.
- Momentum Failures:
- Traders watch for momentum failures, where the indicator fails to reach extreme levels (above -20 or below -80) during an ongoing trend. This may signal a potential shift in momentum.
Application in Uptrends and Downtrends:
- Uptrends:
- Williams %R falling below -80 during an uptrend may indicate a potential buying opportunity, especially when the price starts moving up again.
- Downtrends:
- In a downtrend, Williams %R rising above -20 may signal a potential selling opportunity, especially if the price subsequently moves lower.
Conclusion:
In conclusion, the Williams %R indicator is a valuable tool for traders to assess overbought and oversold conditions in the market. By comparing the current price to the highest high and lowest low over a specified period, this oscillator provides insights into potential trend reversals and the strength of prevailing trends. Traders use buy and sell signals, along with momentum failure observations, to make informed decisions based on Williams %R readings. As with any technical indicator, it is often employed in conjunction with other tools and analysis techniques to enhance the accuracy of trading strategies.
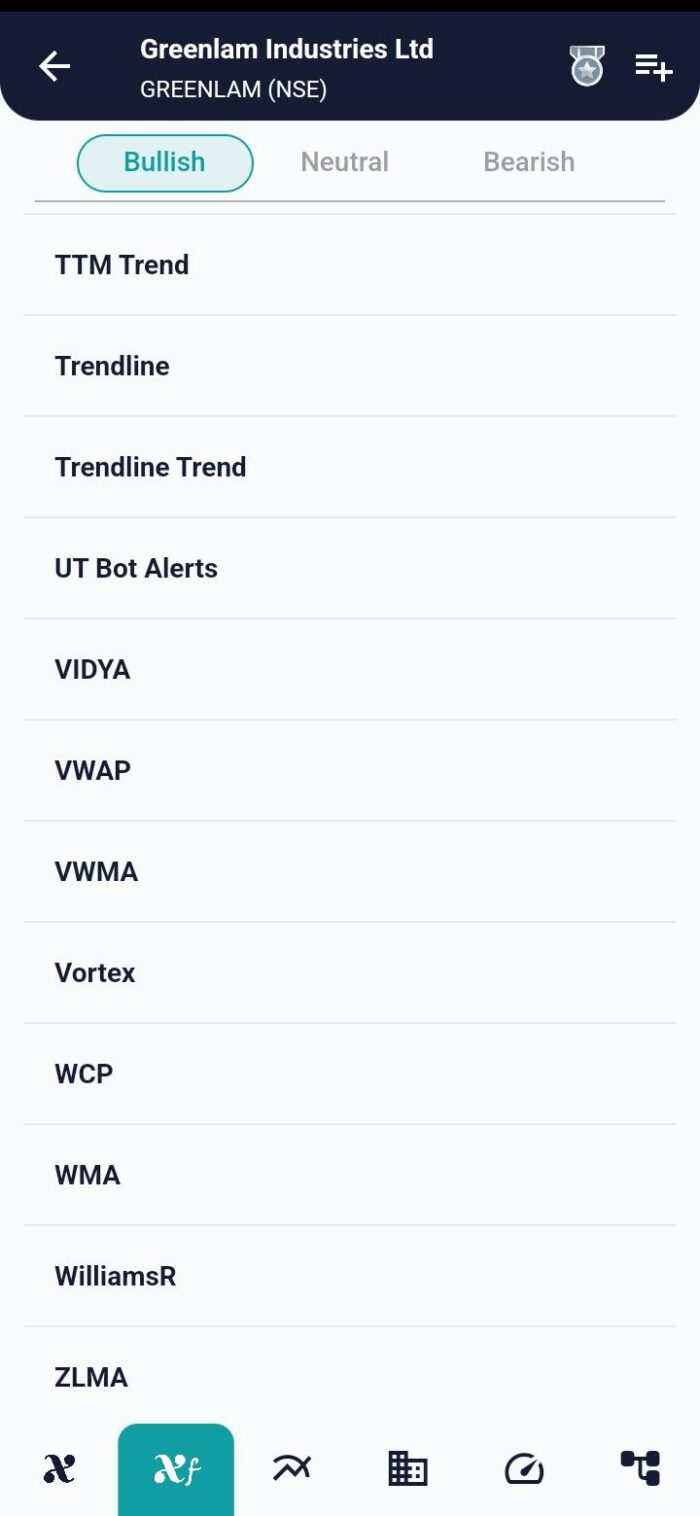
xCalData is an exceptional app available for Android devices that offers unbiased insights into stocks, allowing investors to make informed decisions. With its user-friendly interface and comprehensive features, xCalData provides a valuable resource for anyone interested in the stock market. Download the app from google play.
For Actionable Intelligence, subscribe to xCalData app on Android devices: https://tinyurl.com/downloadxCalData

Popular Posts
-
Stock of Interest . August 23, 2024
#HSCL (NSE) Stock Report | 23 Aug 2024
-
Stock of Interest . August 23, 2024
Add Zerodha trading account to xCalData
-
Stock of Interest . August 23, 2024
What is xCalData , how to use it and how accurate is it?
-
Stock of Interest . August 23, 2024
Jurik Moving Average (JMA): A Profit Trading Insight