Technical Indicator
Posted On: February 9, 2024
Triumph in Trading with TRIX Indicator
Introduction:
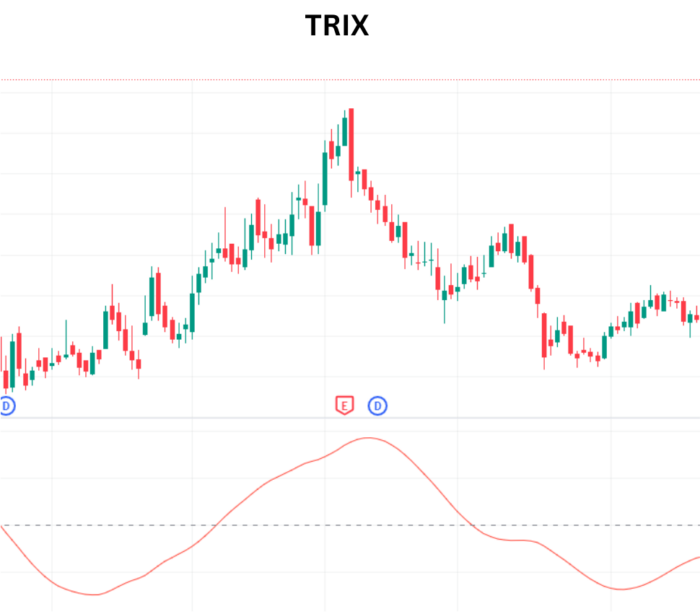
The Triple Exponential Average (TRIX) is a momentum technical indicator revered by technical traders for its ability to filter out insignificant price changes and emphasize essential trends. This guide navigates through the intricacies of this indicator, shedding light on its computation process, application, and interpretation for traders seeking to harness its potential.

Computational Steps for TRIX:
- Logarithmic Transformation:
- Begin by computing the natural logarithm of the daily closing prices. This transformation aids in highlighting percentage changes.
- Initial Exponential Moving Average (EMA):
- Smooth the logarithmic values using an exponential moving average (EMA).
- Double Exponential Smoothing:
- Compute an EMA of the EMA obtained from Step 2, introducing a double exponential smoothing process.
- Triple Exponential Smoothing (TRIX):
- Extend the smoothing further by computing an EMA of the EMA from Step 3, resulting in the triple exponential smoothing characteristic of this indicator.
- 1-Day Difference:
- Derive the 1-day difference between consecutive days’ outputs of the third smoothing (Step 4). This involves subtracting the result of Step 4 today from the result of Step 4 the previous day.
- Scaling Factor:
- Multiply the result in Step 5 by 10,000 for scaling purposes, enhancing visibility and interpretation.
Interpretation and Signal Generation:
- Bullish Signal (Buy):
- If the value of the TRIX is greater than 0, it indicates positive momentum.
- its ‘Buy’ to the signaling a favorable buying opportunity.
- Bearish Signal (Sell):
- Conversely, if the TRIX value is less than 0, it suggests negative momentum.
- its ‘Sell’ to the signaling a potential selling opportunity.
- Neutral Signal:
- If neither of the above conditions is met, implying TRIX hovers around 0, the interpretation is ‘Neutral.’

Strategic Implementation:
- Trend Confirmation:
- TRIX serves as a tool for confirming trends and their momentum direction.
- Traders can integrate TRIX signals with existing strategies for enhanced trend identification.
- Dynamic Scaling:
- The scaling factor introduces dynamic scaling, allowing traders to adapt to different price levels and market conditions.
Conclusion:
Incorporating the Triple Exponential Average (TRIX) into a trader’s toolkit provides a refined perspective on market momentum. The multi-step computation process, coupled with clear interpretation criteria, empowers traders to identify potential buying and selling opportunities. Whether confirming trends or navigating neutral market phases, TRIX offers valuable insights for strategic decision-making. As with any technical indicator, traders are encouraged to combine TRIX signals with comprehensive analyses for a holistic approach to market dynamics.
xCalData is an exceptional app available for Android devices that offers unbiased insights into stocks, allowing investors to make informed decisions. With its user-friendly interface and comprehensive features, xCalData provides a valuable resource for anyone interested in the stock market. Download the app from google play.
For Actionable Intelligence, subscribe to xCalData app on Android devices: https://tinyurl.com/downloadxCalData
Popular Posts
-
Stock of Interest . August 23, 2024
#HSCL (NSE) Stock Report | 23 Aug 2024
-
Stock of Interest . August 23, 2024
Add Zerodha trading account to xCalData
-
Stock of Interest . August 23, 2024
What is xCalData , how to use it and how accurate is it?
-
Stock of Interest . August 23, 2024
Jurik Moving Average (JMA): A Profit Trading Insight