Technical Indicator
Posted On: February 9, 2024
True Strength Index (TSI): An In-Depth Analysis
Introduction:
The True Strength Index (TSI) stands as a formidable technical momentum oscillator, wielding the power to unveil trends and reversals in the dynamic realm of financial markets. This comprehensive technical indicator delves into the intricacies of TSI, unraveling its applications in identifying Buy Sell conditions, signaling trend changes, and serving as a harbinger of potential weaknesses by using xCaldata App.
Key Components:
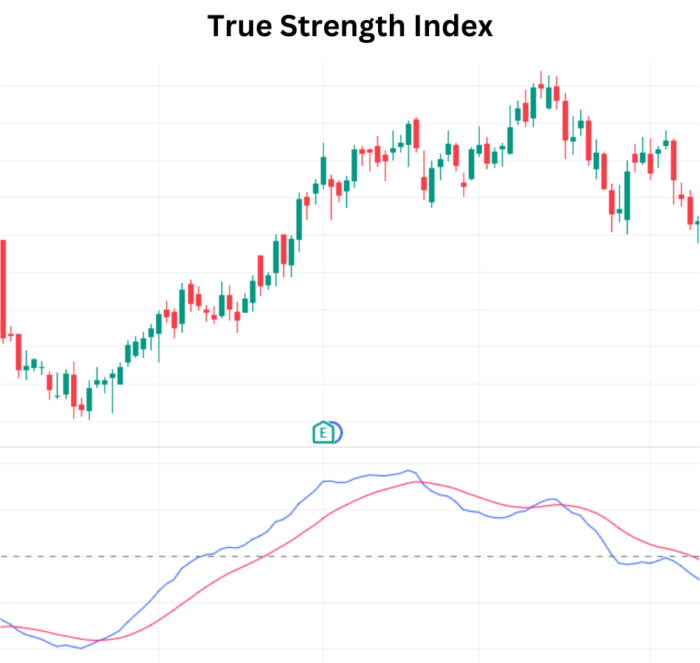
- TSI and TSI Signal:
- The True Strength Index comprises two essential components — TSI itself and the TSI Signal.
- TSI reflects the momentum, while TSI Signal acts as a smoother, aiding in trend identification.
Signal Generation Criteria for True Strength Index:
- Bullish Signal (Buy):
- When both TSI and TSI Signal values reside below zero and converge, a bullish signal emerges.
- This configuration suggests potential buying opportunities, indicating a convergence of downward momentum.
- Bearish Signal (Sell):
- Conversely, a bearish signal materializes when both TSI and TSI Signal values are above zero and converge.
- This scenario implies potential selling opportunities, marking a convergence of upward momentum.
Strategic Implications:
- Trend Confirmation:
- True Strength Index excels in confirming trends, providing a robust framework for identifying shifts in momentum.
- Traders can leverage True Strength Index signals to validate existing trends and anticipate potential reversals.
- Divergence Warning:
- True Strength Index prowess extends to warning traders about potential weaknesses through divergence.
- Divergence between TSI and price movements can signify underlying shifts in market dynamics.
- Overbought/Oversold Conditions:
- True Strength Index oscillatory nature allows traders to gauge overbought and oversold conditions.
- Monitoring TSI values relative to the zero line aids in assessing the intensity of buying or selling pressures.
Implementation Strategies:
- Centerline Crossovers:
- Centerline crossovers, where True Strength Index transitions across the zero line, can be pivotal signals.
- Positive crossovers indicate potential bullish trends, while negative crossovers hint at bearish sentiments.
- Signal Line Utilization:
- TSI Signal acts as a smoothing mechanism, enhancing the clarity of trend signals.
- Traders can utilize TSI Signal crossovers for refined entry and exit points.
Conclusion:
Incorporating the True Strength Index (TSI) into a trader’s analytical arsenal opens avenues for nuanced trend analysis and strategic decision-making. The convergence and divergence patterns, coupled with overbought/oversold assessments, empower traders to navigate the complexities of market dynamics. Whether confirming existing trends or preparing for potential reversals, TSI stands as a valuable ally in deciphering the true strength behind price movements. As with any technical indicator, a comprehensive approach that integrates TSI signals with broader market insights enhances its effectiveness in guiding traders through the ever-evolving financial landscape.
xCalData is an exceptional app available for Android devices that offers unbiased insights into stocks, allowing investors to make informed decisions. With its user-friendly interface and comprehensive features, xCalData provides a valuable resource for anyone interested in the stock market. Download the app from google play.
For Actionable Intelligence, subscribe to xCalData app on Android devices: https://tinyurl.com/downloadxCalData
Popular Posts
-
Stock of Interest . August 23, 2024
#HSCL (NSE) Stock Report | 23 Aug 2024
-
Stock of Interest . August 23, 2024
Add Zerodha trading account to xCalData
-
Stock of Interest . August 23, 2024
What is xCalData , how to use it and how accurate is it?
-
Stock of Interest . August 23, 2024
Jurik Moving Average (JMA): A Profit Trading Insight