Candlestick Pattern
Posted On: September 27, 2023
Uncovering the Hammer Candlestick Pattern in Trading
A Comprehensive Manual for Traders:
In the dynamic world of financial markets, traders and investors often turn to technical analysis to make informed decisions. Candlestick patterns are a foundational element of this analysis, offering valuable insights into market sentiment. Among these patterns, the “Hammer” candlestick pattern stands out as a powerful indicator of potential trend reversals. In this blog post, we will explore the concept of the Hammer candlestick pattern, delve into its defining characteristics, and discuss how traders can effectively identify and interpret it.
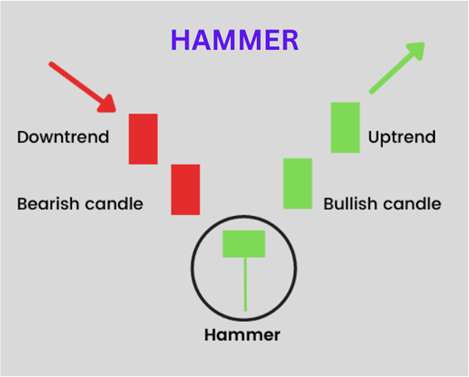
The Hammer is a single-candlestick pattern known for its distinct shape and its significance in the realm of technical analysis. It is characterized by a small real body near the top of the candle, a long lower shadow, and little to no upper shadow. The pattern’s name comes from its resemblance to a hammer, with a small head and a long handle.
Characteristics of Dragonfly Doji:
To recognize the Hammer pattern, traders should focus on the following key elements:
- Small Real Body: The Hammer has a small real body, often coloured differently from the preceding trend to represent a potential reversal.
- Long Lower Shadow: The most distinctive feature is the long lower shadow, which extends below the real body and any upper shadow.
- No Upper Shadow or a Very Short Upper Shadow: The Hammer typically lacks an upper shadow or, if present, it is extremely short.
Interpreting the Dragonfly Doji:
The Hammer carries significant interpretations based on its context:
- Reversal Signal: When the Hammer appears after a sustained downtrend, it signals a potential bullish reversal. It suggests that sellers may be losing control, and buyers are stepping in.
- Market Support: The long lower shadow indicates that prices dipped significantly during the trading session but ultimately closed near the opening level. This represents strong buying interest at lower price levels.
- Confirmation: Traders often seek additional confirmation through technical indicators, such as rising volume, before considering trade entries based on the Hammer.
Trade Execution and Risk Management:
When a Hammer pattern is confirmed and occurs after a downtrend, traders may consider opening long positions or tightening stop-loss levels on existing short positions. Sound risk management practices, including the use of stop-loss orders, are essential to protect against potential losses.
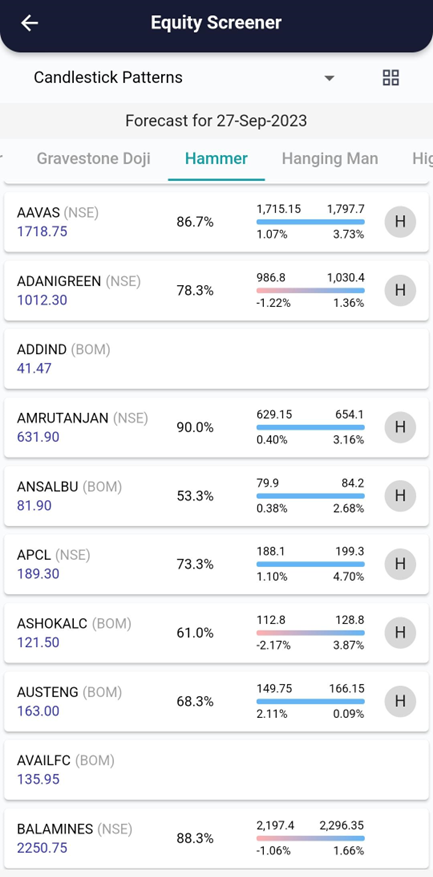
xCalData analyses the candles of individual stocks daily and identifies the stocks forming various patterns. Checkout xCalData app to know all the candle stick patterns formed by the stock of your interest.
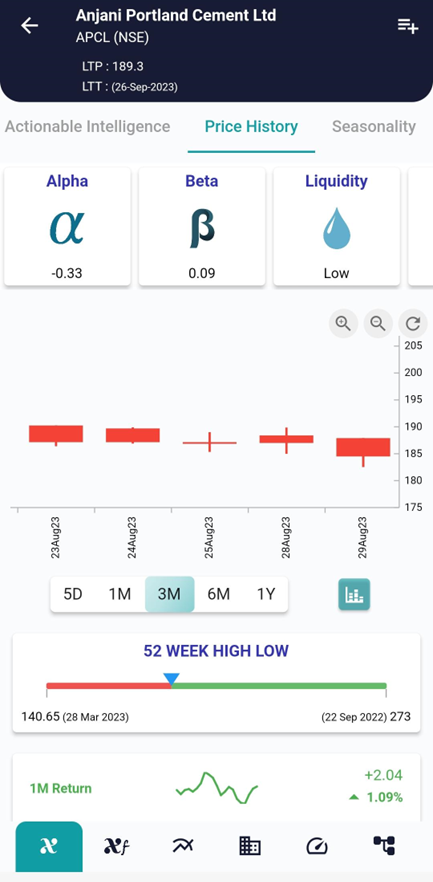
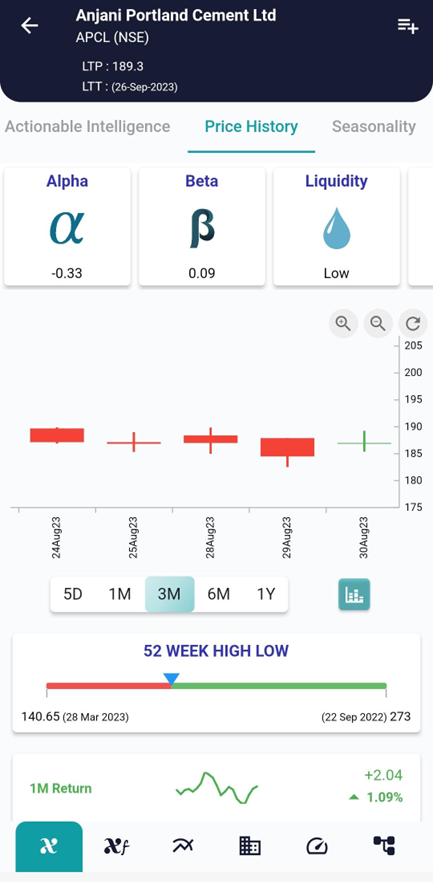
Example, on 29 Aug the stock showed the Hammer Candlestick Pattern and on30 Aug the stock started going up as can be seen in the interpretation above.
Conclusion:
The Hammer candlestick pattern is a valuable tool in the trader’s arsenal, offering insights into potential trend reversals and support levels. However, like all trading signals, it should be used judiciously, in conjunction with comprehensive analysis and risk management strategies. Successful trading requires a deep understanding of candlestick patterns and adaptability to changing market conditions.
Trading always involves risk, and it is crucial to develop a well-rounded trading strategy, including risk management techniques, to increase your productivity and achieve long-term success in the financial markets, Visit and download xCalData.
Where can I see further insights on this stock?
xCalData offers unbiased insights into stocks. Download the app from google play. For Actionable Intelligence, subscribe to xCalData app on Android devices: Download here

Disclaimer: The securities quoted are for illustration only and are not recommendatory.
Popular Posts
-
Stock of Interest . August 23, 2024
#HSCL (NSE) Stock Report | 23 Aug 2024
-
Stock of Interest . August 23, 2024
Add Zerodha trading account to xCalData
-
Stock of Interest . August 23, 2024
What is xCalData , how to use it and how accurate is it?
-
Stock of Interest . August 23, 2024
Jurik Moving Average (JMA): A Profit Trading Insight