Candlestick Pattern
Posted On: August 21, 2023
Understanding the Piercing Candlestick Pattern in Trading
A Comprehensive Manual for Traders:
In the world of financial markets, traders employ various technical analysis tools to gain insights into potential trend reversals and market dynamics. Among these tools, candlestick patterns hold a special place for their ability to reveal crucial information about market sentiment. The Piercing pattern is one such candlestick pattern that traders use to identify potential bullish reversals. In this blog post, we will delve into the concept of the Piercing pattern, explore its identification criteria, and discuss how traders can interpret this pattern to enhance their trading strategies.
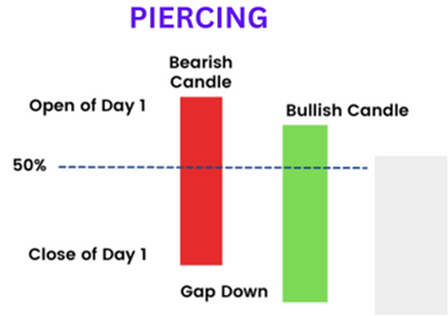
The Piercing pattern is a two-candlestick formation that typically occurs during a downtrend. It suggests that the bears’ control may be weakening, potentially leading to a bullish reversal. The pattern consists of a bearish candlestick followed by a bullish candlestick that opens below the low of the previous day and closes above the midpoint of the first candlestick’s body.
Characteristics of Piercing pattern:
To effectively spot the Piercing pattern, traders must take note of the following defining features:
- Downtrend: The pattern emerges within an ongoing downtrend, signaling the possibility of a bullish reversal.
- Bearish Candlestick: The initial candlestick manifests bearish sentiments, reflective of the prevailing selling pressure.
- Bullish Candlestick: The subsequent candlestick adopts a bullish stance, opening below the preceding day’s candlestick.
- Midpoint Close: The closing price of the second candlestick resides above the midpoint of the first candlestick’s body, symbolizing a probable shift in momentum.
Interpreting Piercing pattern:
The Piercing pattern indicates a potential reduction in bearish dominance and an increasing influence of buyers, possibly leading to a trend reversal. It suggests a transition in market sentiment from bearish to bullish. Traders interpret this pattern as an opportunity to consider initiating long positions or tightening stop-loss levels on existing short positions.
Confirmation and Trading Strategies:
While the Piercing pattern serves as a potential bullish signal, seasoned traders often seek supplementary confirmation prior to executing trades. They may account for the following factors:
- Volume Validation: Heightened trading volume during the pattern’s formation enhances the credibility of the potential reversal.
- Support and Resistance Levels: Identification of critical support and resistance levels bolsters pattern authenticity and guides in setting viable price targets.
- Technical Indicators: Integrating the Piercing pattern with other technical indicators, such as moving averages or oscillators, enriches the trading decision-making process.
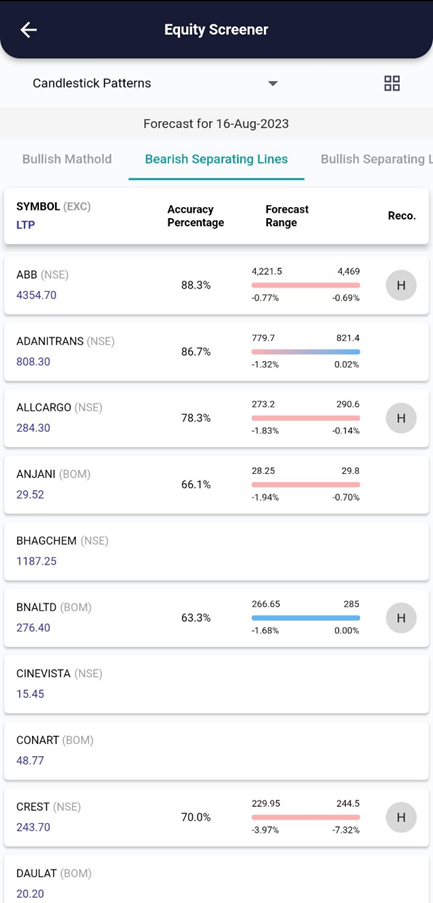
xCalData analyses the candles of individual stocks daily and identifies the stocks forming various patterns. Checkout xCalData app to know all the candle stick patterns formed by the stock of your interest.
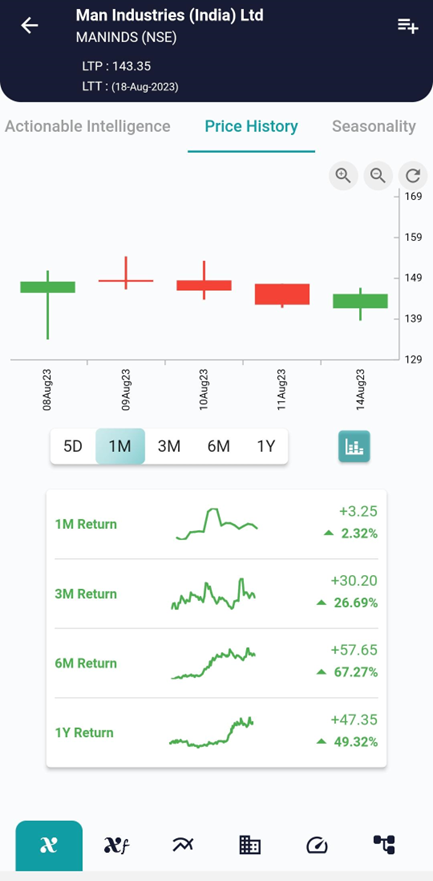
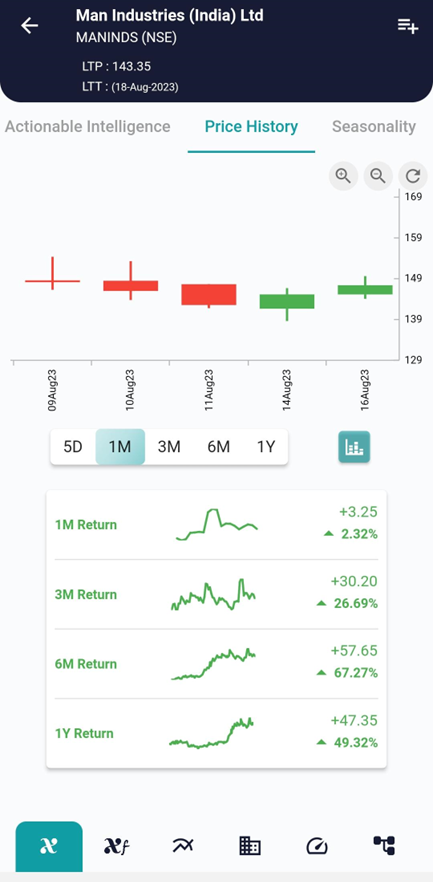
Example, on 14 Aug the stock showed the Piercing pattern and on 16 Aug the stock started going up as can be seen in the charts above.
Conclusion:
The Piercing pattern emerges as a valuable tool for traders, imparting valuable insights into potential bullish reversals and market sentiment shifts. By comprehending its identification criteria and adeptly interpreting this pattern, traders can refine their trading strategies.
However, it is crucial to acknowledge that no pattern guarantees success, and sound trading decisions necessitate additional verification and comprehensive analysis.
Trading always involves risk, and it is crucial to develop a well-rounded trading strategy, including risk management techniques, to increase your productivity and achieve long-term success in the financial markets, Visit and download xCalData.
Where can I see further insights on this stock?
xCalData offers unbiased insights into stocks. Download the app from google play. For Actionable Intelligence, subscribe to xCalData app on Android devices: Download here

Disclaimer: The securities quoted are for illustration only and are not recommendatory.
Popular Posts
-
Stock of Interest . August 23, 2024
#HSCL (NSE) Stock Report | 23 Aug 2024
-
Stock of Interest . August 23, 2024
Add Zerodha trading account to xCalData
-
Stock of Interest . August 23, 2024
What is xCalData , how to use it and how accurate is it?
-
Stock of Interest . August 23, 2024
Jurik Moving Average (JMA): A Profit Trading Insight