Strategy
Posted On: January 19, 2024
Unleashing Precision with EMA RSI Strategy
In the realm of trading strategies, the EMA RSI strategy, emerges as a powerful tool grounded in the Relative Strength Index (RSI). This strategy utilizes a combination of technical, price, and calendar data to make informed decisions in the dynamic financial markets. This blog post will delve into the intricacies of the EMA RSI strategy, including its operational principles, the datasets it relies on, key parameters, and the interpretations guiding buy and sell decisions using XCaldata App.
Introduction to the EMA RSI Strategy
The EMA RSI strategy, centered around the Relative Strength Index (RSI), offers traders a systematic approach to navigate market trends. While acknowledging the inherent risks in any trading strategy, the EMA RSI strategy is recognized for its efficacy when applied with prudence.
Datasets Utilized in the Strategy
To execute the EMA RSI strategy successfully, traders leverage three key datasets:
- Technical Data: This dataset incorporates various technical indicators essential for strategy decision-making. Technical analysis forms the backbone of the strategy, aiding in trend identification and potential entry or exit points.
- Price Data: Price data plays a fundamental role, providing information on opening, closing, high, and low prices for each trading session. This data is crucial for computing indicators like Exponential Moving Averages (EMA) and RSI.
- Calendar Data: Calendar data includes information on trading session timing, market events, and economic releases. Understanding the broader market context enhances decision-making and risk management.
Key Parameters of the Strategy
The EMA RSI strategy relies on specific parameters to guide its calculations and interpretations:
- Previous Price Data: The strategy necessitates access to the previous 300 days’ price data for a single business day. This historical perspective enables a comprehensive analysis of market trends and patterns.
- Previous Strategy Outputs: Historical outputs from previous strategy executions are crucial for interpreting current conditions. These outputs guide buy and sell decisions, ensuring a holistic approach to strategy implementation.
Interpretations Guiding Buy and Sell Decisions
BUY:
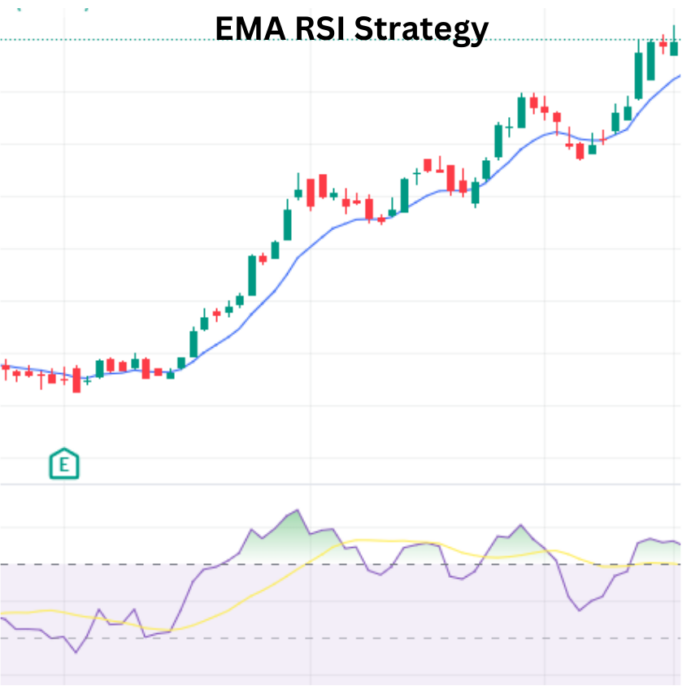
- If today’s close is above the 200 EMA and the RSI value is greater than 50, the strategy generates a buy signal. This condition suggests a potential bullish trend.
SELL:
- If today’s RSI value is less than 50, and it reached 70 and is falling, the strategy generates a sell signal. This condition indicates a potential reversal from an overbought condition.
Conclusion: Navigating Trends with Precision
In conclusion, the EMA RSI strategy provides traders with a robust framework for navigating market trends using the RSI indicator. By incorporating technical, price, and calendar data, along with key parameters and interpretations, traders can make informed buy and sell decisions. It is essential for traders to exercise caution, continuously monitor market conditions, and adapt their strategies to changing dynamics. As the EMA RSI strategy becomes an integral part of a trader’s toolkit, it enhances precision and opens doors to potential opportunities in the ever-evolving landscape of financial markets.
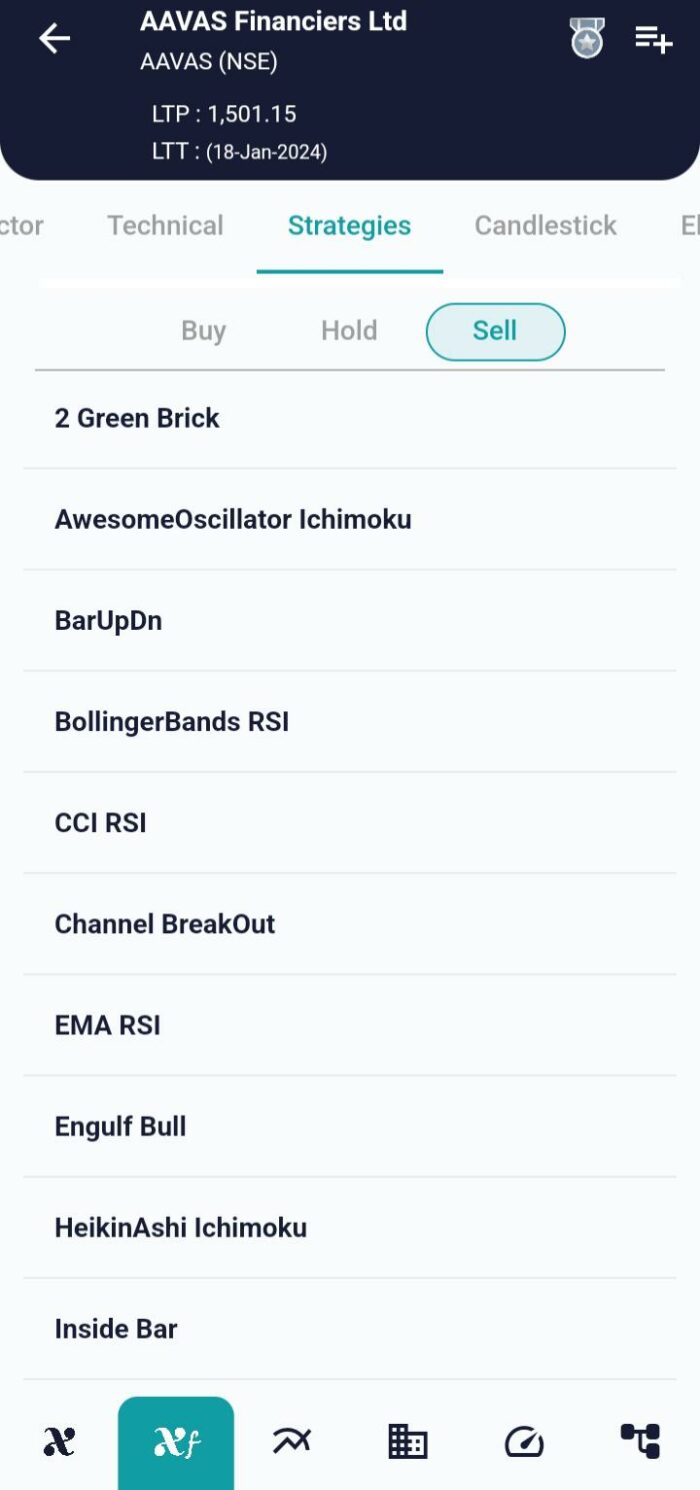
xCalData is an exceptional app available for Android devices that offers unbiased insights into stocks, allowing investors to make informed decisions. With its user-friendly interface and comprehensive features, xCalData provides a valuable resource for anyone interested in the stock market. Download the app from google play.
For Actionable Intelligence, subscribe to xCalData app on Android devices: https://tinyurl.com/downloadxCalData
Popular Posts
-
Stock of Interest . August 23, 2024
#HSCL (NSE) Stock Report | 23 Aug 2024
-
Stock of Interest . August 23, 2024
Add Zerodha trading account to xCalData
-
Stock of Interest . August 23, 2024
What is xCalData , how to use it and how accurate is it?
-
Stock of Interest . August 23, 2024
Jurik Moving Average (JMA): A Profit Trading Insight