Technical Indicator
Posted On: January 30, 2024
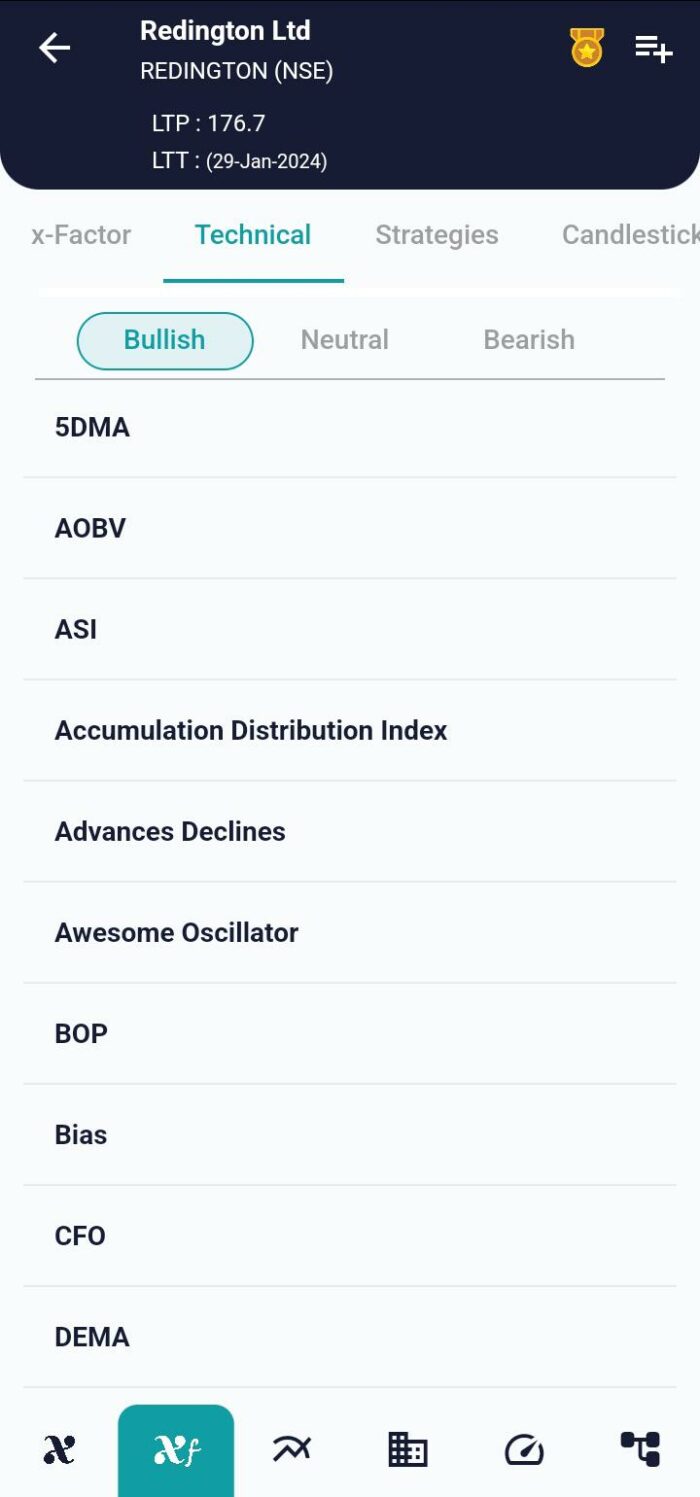
Unleashing the Power of Balance of Power (BOP) Indicator in Trading: 1 step Guide for Success
In the intricate landscape of financial markets, traders are constantly seeking tools that offer insights into market dynamics and potential trends. One such powerful instrument is the Balance of Power (BOP) indicator, a momentum indicator that sheds light on the equilibrium between buyers and sellers. In this comprehensive guide, we’ll delve into the intricacies of the BOP technical indicator, its mathematical foundation, and how traders can leverage its insights for informed decision-making. Exploring its mathematical formula, interpretation, and practical applications by using xCaldata App.
Unveiling the Balance of Power (BOP) Indicator
Introduction to BOP:
The Balance of Power (BOP) indicator stands as a stalwart in the realm of technical analysis. Its primary objective is to gauge the strength and direction of buying and selling pressure in the market. By assessing the balance between buyers and sellers, the BOP indicator becomes a valuable tool for identifying potential trend reversals or continuations.
Mathematical Foundation:
The mathematical underpinning of the BOP indicator is elegantly simple yet robust in its analytical capabilities. It is calculated using the formula:
BOP = [ (Close – Open) / (High – Low)
Additionally, a moving average (MA) of the BOP, denoted as BOP_MA, can be calculated using the Simple Moving Average (SMA) formula. This moving average smoothens out the BOP values, providing a clearer trend perspective:
BOP_MA= SMA of [ Close – Open) / (High – Low) ].
Interpreting BOP: Decoding Market Sentiment
BalanceOfPower_Value:
The crux of interpreting the BOP indicator lies in understanding the BalanceOfPower_Value. This value is derived directly from the BOP and serves as a key metric for assessing market sentiment. Here’s how to interpret it:
- Zero-line Crossover:
- Bullish: When BOP crosses above the 0 value, it signals a bullish sentiment.
- Bearish: When BOP crosses below the 0 value, it indicates a bearish sentiment.
- Neutral: If BOP remains unchanged around the 0 value, it suggests a neutral sentiment.
BOP_DMA_Value:
For a more nuanced interpretation, traders often refer to the BOP_DMA_Value, which involves the BOP moving average. This moving average provides a smoothed perspective on market dynamics.
- Zero-line Crossover with Moving Average:
- Bullish: When BOP_MA crosses above the 0 value, it implies a bullish trend.
- Bearish: If BOP_MA crosses below the 0 value, it signifies a bearish trend.
- Neutral: When BOP_MA hovers around the 0 value without crossing, it indicates a neutral trend.
Incorporating BOP into Your Trading Arsenal
Identifying Trend Reversals:
BOP’s prowess lies in its ability to identify potential trend reversals. Traders keen on spotting shifts in market sentiment can leverage BOP crossovers to make timely decisions.
Confirmation with Moving Average:
The BOP_DMA adds an extra layer of confirmation. Traders can use the smoothed BOP values to confirm trends, reducing the impact of short-term fluctuations.
Risk Mitigation:
Incorporating BOP into risk management strategies is paramount. Understanding shifts in market sentiment can help traders set appropriate stop-loss levels and manage risk effectively.
Conclusion: Mastering Market Dynamics with BOP
In conclusion, the Balance of Power (BOP) indicator serves as a formidable ally for traders navigating the complexities of the financial markets. By deciphering the nuances of buying and selling pressure, BOP empowers traders to make well-informed decisions. Whether you are a seasoned trader or just starting, mastering the art of interpreting Balance of Power BOP can significantly enhance your ability to ride the waves of market momentum and make strategic moves.
xCalData is an exceptional app available for Android devices that offers unbiased insights into stocks, allowing investors to make informed decisions. With its user-friendly interface and comprehensive features, xCalData provides a valuable resource for anyone interested in the stock market. Download the app from google play.
For Actionable Intelligence, subscribe to xCalData app on Android devices: https://tinyurl.com/downloadxCalData
Popular Posts
-
Stock of Interest . August 23, 2024
#HSCL (NSE) Stock Report | 23 Aug 2024
-
Stock of Interest . August 23, 2024
Add Zerodha trading account to xCalData
-
Stock of Interest . August 23, 2024
What is xCalData , how to use it and how accurate is it?
-
Stock of Interest . August 23, 2024
Jurik Moving Average (JMA): A Profit Trading Insight