Technical Indicator
Posted On: February 5, 2024
Unleashing the Power of the Inertia Indicator in Trading
In the vast landscape of technical indicators, the Inertia technical indicator emerges as a dynamic tool, seamlessly blending the realms of volatility and trend analysis. In this exploration, we’ll delve into the intricacies of the Inertia Indicator, understanding its mechanics, and unraveling the fusion with the Linear Regression Indicator to enhance its precision by using xCaldata app.

Deciphering the Inertia Indicator
Understanding the Formula:
The Inertia Indicator, an arbiter of trend strength, is meticulously crafted with the amalgamation of volatility and Linear Regression. The formula orchestrates this union, creating a scale from 0 to 100. Here’s a glimpse into the core formula:
Threshold of Trend Reversal:
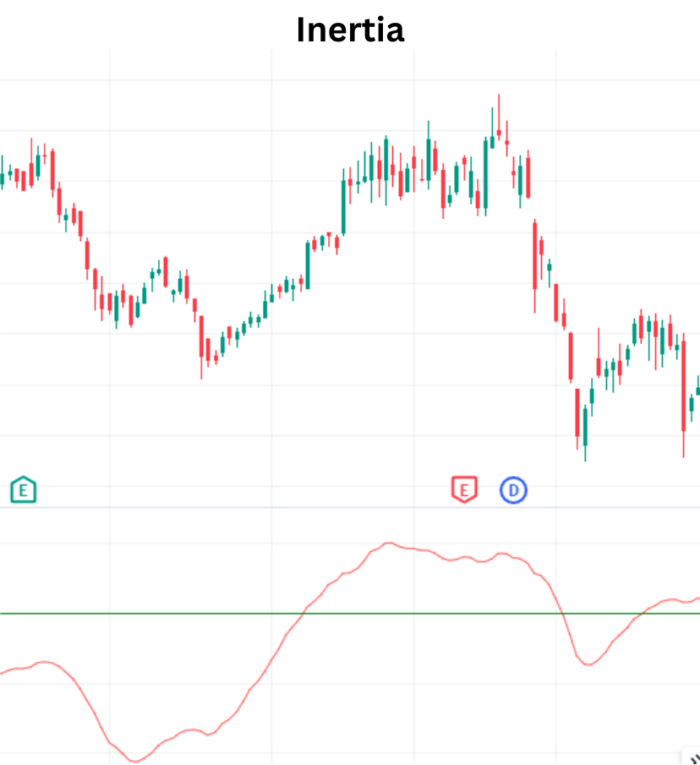
The Inertia Indicator employs a scale of 0 to 100, with 50 serving as the fulcrum. Crossing this threshold unveils potential trend reversals. A rise above 50 heralds a bullish signal, while a dip below 50 signals a bearish reversal.
Interpreting the Inertia Indicator in Action
Bullish Scenarios:
- Indicator Below 50, Followed by a Rise:
- A buy signal is generated as the Inertia Indicator, initially below 50, embarks on an upward journey.
Bearish Signals:
- Indicator Above 50, Subsequently Dropping:
- A sell signal emanates when the Inertia Indicator, positioned above 50, takes a downward plunge.

The Fusion with Linear Regression for Enhanced Insights
Smoothing Volatility with Linear Regression:
The Inertia Indicator enlists the prowess of the Linear Regression Indicator to ensure a smoothed representation. This fusion mitigates noise, offering a clearer perspective on trend dynamics.
Crafting Trading Strategies with the Inertia Indicator
Entry and Exit Points:
- Buy Signals:
- Inertia Indicator below 50, followed by an ascent.
- Sell Signals:
- Inertia Indicator above 50, succeeded by a descent.
Risk Management:
- Confirmation with Other Indicators:
- Bolster your decisions by corroborating Inertia Indicator signals with insights from diverse indicators.
Incorporating the Inertia Indicator into Your Trading Arsenal
Versatility Across Timeframes:
- Adaptable to Various Time Horizons:
- From intraday to long-term trends, the Inertia Indicator flexes its versatility.
Continuous Learning:
- Stay Updated with Market Conditions:
- Markets evolve, and so should your strategies. Regularly reassess and refine your approach.
Conclusion
The Inertia Indicator, a testament to the fusion of volatility and trend metrics, provides traders with a nuanced lens to navigate the ever-changing seas of financial markets. As you integrate this indicator into your trading repertoire, embrace its signals with a strategic mindset. Remember, the Inertia Indicator is a guide, and prudence lies in complementing its insights with a holistic approach to market analysis. May your trading journey be marked by well-timed entries and profitable exits!
xCalData is an exceptional app available for Android devices that offers unbiased insights into stocks, allowing investors to make informed decisions. With its user-friendly interface and comprehensive features, xCalData provides a valuable resource for anyone interested in the stock market. Download the app from google play.
For Actionable Intelligence, subscribe to xCalData app on Android devices: https://tinyurl.com/downloadxCalData
Popular Posts
-
Stock of Interest . August 23, 2024
#HSCL (NSE) Stock Report | 23 Aug 2024
-
Stock of Interest . August 23, 2024
Add Zerodha trading account to xCalData
-
Stock of Interest . August 23, 2024
What is xCalData , how to use it and how accurate is it?
-
Stock of Interest . August 23, 2024
Jurik Moving Average (JMA): A Profit Trading Insight