General
Posted On: October 20, 2023
Unlock Historical Doubling Period in Just 2 Minutes
The historical doubling period is a measure used in finance to assess how long it took for an investment, such as a stock or asset, to double in value over a specific historical time frame. It’s a way to understand the growth rate and performance of an investment over a set period.
How to Calculate Historical Doubling Period
To calculate the historical doubling period for an investment, you need the following information:
- Beginning Value: The starting value of the investment at the beginning of the chosen time frame.
- Ending Value: The ending value of the investment at the end of the chosen time frame.
- Number of Years: The duration of the investment or time frame in years.
The formula to calculate the historical doubling period is as follows:
Doubling Period (in years) = ln(2) / ln(1 + (Ending Value / Beginning Value))
Here’s a breakdown of the formula:
lnrepresents the natural logarithm.2represents the doubling of the initial value.1represents the initial value plus its growth.(Ending Value / Beginning Value)calculates the growth rate of the investment over the chosen period.
Keep in mind that this formula provides an approximation of the historical doubling period. It assumes a constant growth rate, which may not accurately represent the actual performance of an investment, as real-world investments can experience varying growth rates.
To find historical doubling periods for specific stocks or investments, you can use historical price data and apply the formula mentioned above. Many financial websites and tools provide historical price data that you can use for this calculation. But Calculating for each you want to analyze is time consuming process.
Where can I Find Historical Doubling Period of the Stocks:
The Answer for your question is XCalData, Here you can find Historical Doubling Period, Stock Reports, Forecast, Strategies, Seasonality, Support and Resistance, Stop Loss, Trend, Target Price, Technical Ratios, Financial Ratios, and Many more.
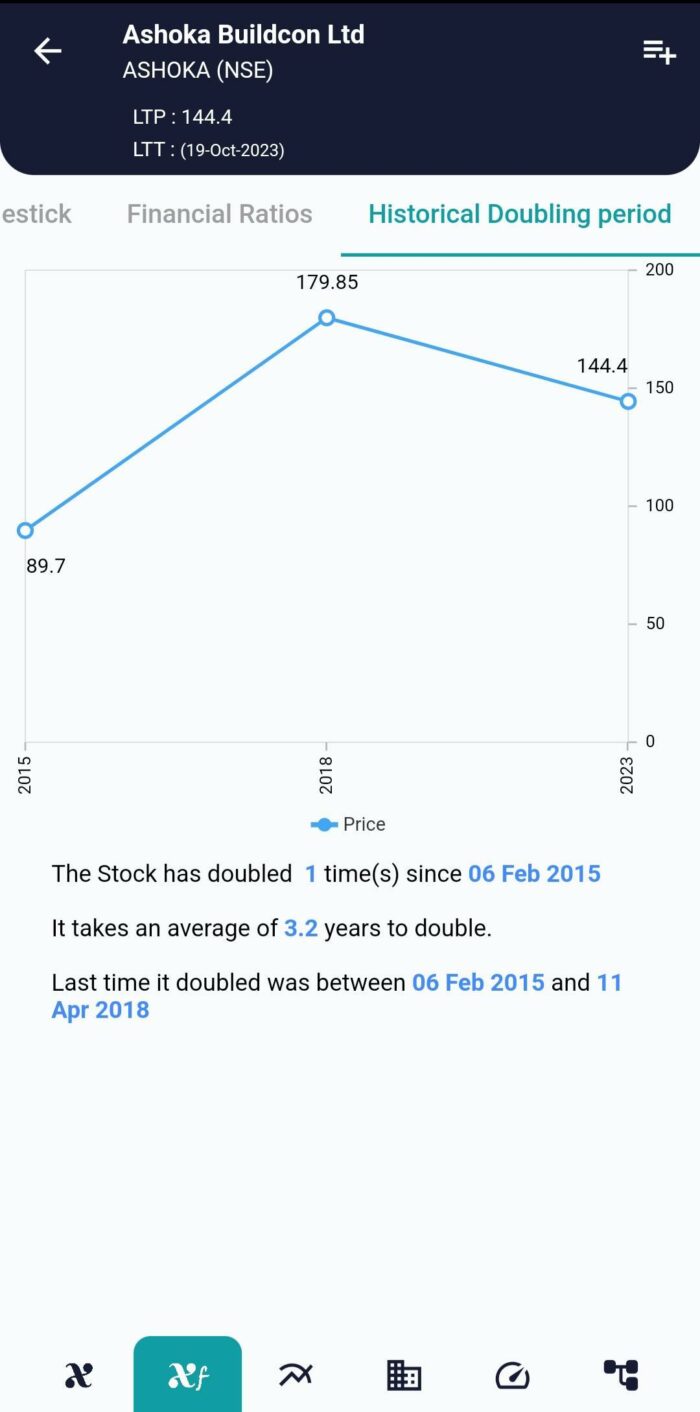
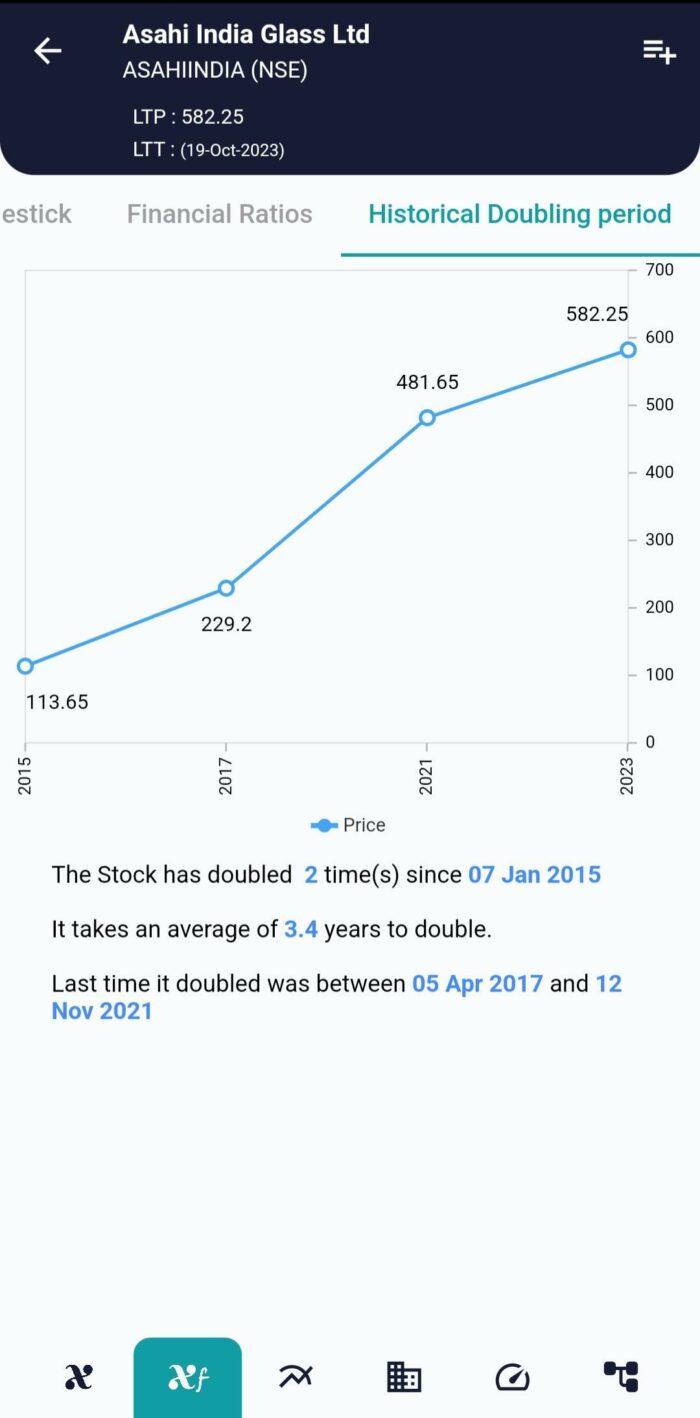
In the above pictures we can easily able to see the number of times the stock doubled, average period(in years) to double and the last time the stock doubled. Doing these analysis are so much important, By using XCalData you can easily able to make Actionable Decisions.
xCalData is an exceptional app available for Android devices that offers unbiased insights into stocks, allowing investors to make informed decisions. With its user-friendly interface and comprehensive features, xCalData provides a valuable resource for anyone interested in the stock market. Download the app from google play.
For Actionable Intelligence, subscribe to xCalData app on Android devices: https://tinyurl.com/downloadxCalData
Popular Posts
-
Stock of Interest . August 23, 2024
#HSCL (NSE) Stock Report | 23 Aug 2024
-
Stock of Interest . August 23, 2024
Add Zerodha trading account to xCalData
-
Stock of Interest . August 23, 2024
What is xCalData , how to use it and how accurate is it?
-
Stock of Interest . August 23, 2024
Jurik Moving Average (JMA): A Profit Trading Insight