Technical Indicator
Posted On: January 30, 2024
Unlocking Market Insights with AMAT: Archer Moving Average Trends
In the ever-evolving landscape of financial markets, traders are constantly on the lookout for robust indicators that provide valuable insights into trends, returns, and market dynamics. One such indicator making waves is AMAT, short for Archer Moving Average Trends. Designed to operate on trend-based principles, AMAT proves to be a versatile tool catering to both long-run and short-run technical indicator. In this blog post, we delve into the intricacies of AMAT, exploring its components, interpretation, and how traders can leverage its signals for informed decision-making by using xCaldata App.
Components of AMAT:
AMAT relies on two key components: the Fast Moving Average (Fast MA) and the Slow Moving Average (Slow MA). These moving averages are calculated using the Exponential Moving Average (EMA) of closing prices over specific periods. The dynamics of the Fast and Slow MAs play a pivotal role in generating signals.
- Fast MA: Calculated as the EMA of close prices over fast periods.
- Slow MA: Calculated as the EMA of close prices over slow periods.
Additionally, AMAT considers the rate of change of these moving averages over two periods to identify trends:
- Fast Increasing: Fast MA . diff(2) > 0
- Fast Decreasing: Fast MA . diff(2) < 0
- Slow Increasing: Slow MA . diff(2) < 0
- Slow Decreasing: Slow MA . diff(2) > 0
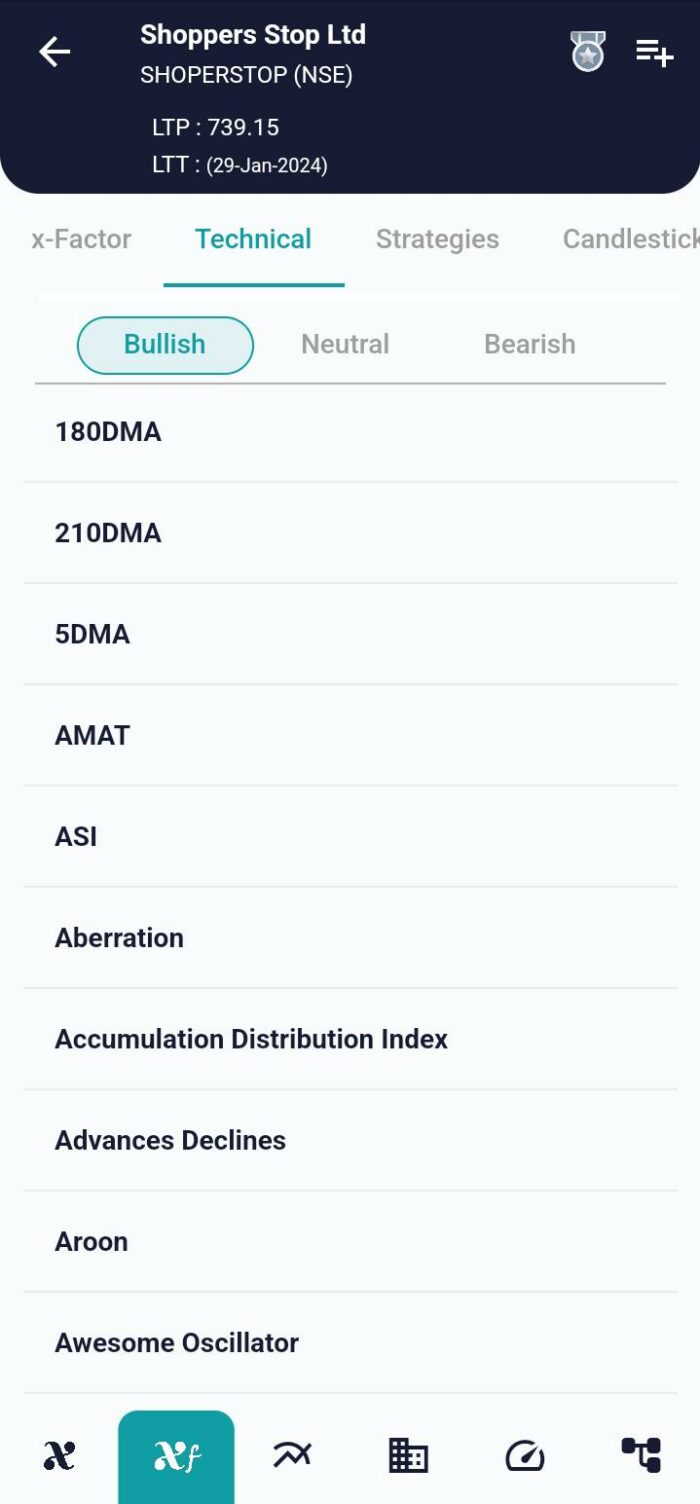
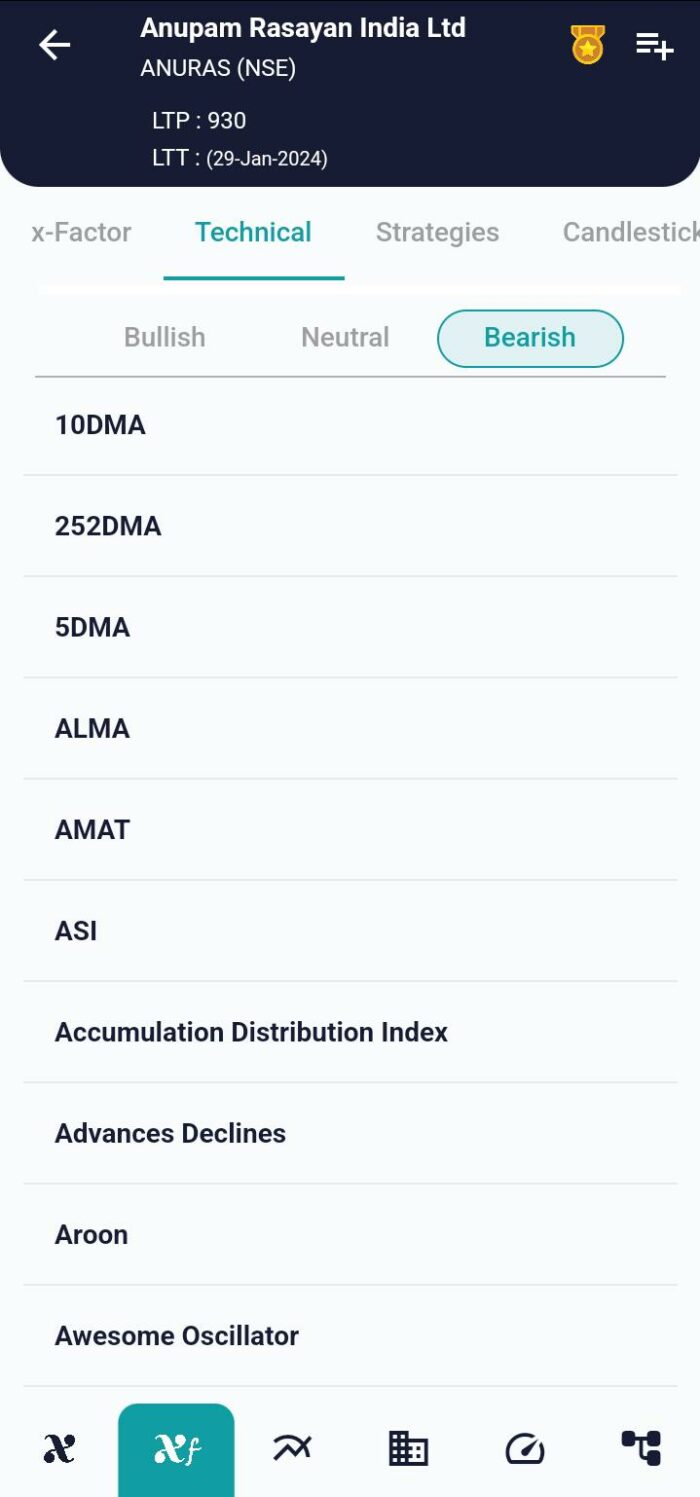
AMAT Signals:
AMAT generates signals based on the interplay of Fast and Slow MAs, providing valuable information about trend directions. The following signals are key to understanding market sentiment:
- Positive Fast: Fast Increasing & Slow Decreasing
- Negative Fast: Fast Increasing & Slow Increasing
- Long Run: Positive Fast OR Negative Fast
- Positive Slow: Fast Decreasing & Slow Increasing
- Negative Slow: Fast Decreasing & Slow Decreasing
- Short Run: Positive Slow OR Negative Slow
Interpretation of AMAT:
AMAT signals are clear and actionable:
- Bullish Signal: If the Long Run signal is 1, it’s a buy signal. This indicates a positive trend outlook, suggesting potential buying opportunities.
- Bearish Signal: If the Short Run signal is 1, this is a sell signal. This implies a negative trend outlook, signaling potential selling or shorting opportunities.
Application in Trading:
Traders can leverage AMAT signals to enhance their decision-making processes. The Long Run and Short Run signals provide a nuanced view of market trends, allowing traders to align their strategies with prevailing conditions. By understanding the dynamics of Fast and Slow MAs, traders gain a comprehensive perspective on potential entry and exit points.
Conclusion:
In the realm of technical analysis, AMAT stands out as a reliable indicator for traders seeking clarity in trend identification. Its versatile approach, catering to both long-run and short-run strategies, makes it a valuable tool in a trader’s arsenal. As with any technical indicator, it’s essential for traders to conduct thorough analyses, considering additional indicators and market factors. AMAT, with its systematic approach, provides a meaningful contribution to the trader’s toolkit, helping navigate the complexities of financial markets with confidence and precision.
xCalData is an exceptional app available for Android devices that offers unbiased insights into stocks, allowing investors to make informed decisions. With its user-friendly interface and comprehensive features, xCalData provides a valuable resource for anyone interested in the stock market. Download the app from google play.
For Actionable Intelligence, subscribe to xCalData app on Android devices: https://tinyurl.com/downloadxCalData
Popular Posts
-
Stock of Interest . August 23, 2024
#HSCL (NSE) Stock Report | 23 Aug 2024
-
Stock of Interest . August 23, 2024
Add Zerodha trading account to xCalData
-
Stock of Interest . August 23, 2024
What is xCalData , how to use it and how accurate is it?
-
Stock of Interest . August 23, 2024
Jurik Moving Average (JMA): A Profit Trading Insight