Candlestick Pattern
Posted On: August 31, 2023
Unlocking Opportunities: Trading with the Bullish Belt Hold Candlestick Pattern
A Comprehensive Manual for Traders:
In the world of technical analysis, traders and investors utilize various candlestick patterns to gain insights into market dynamics and potential trend reversals. One such pattern is the Bullish Belt Hold, which holds significance for traders seeking bullish signals. In this blog post, we will explore the concept of the Bullish Belt Hold pattern, delve into its characteristics, and discuss how traders can identify and interpret this pattern to enhance their trading decisions.
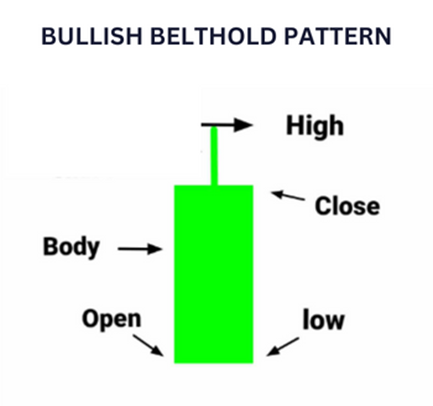
The Bullish Belt Hold is a single candlestick pattern that often occurs during a downtrend and signals a potential reversal to a bullish direction. It represents a sudden shift in market sentiment from bearish to bullish. The pattern is characterized by a long bullish candlestick that opens near its low and closes near its high, leaving little to no lower shadow.
Characteristics of Bullish Belt Hold:
To identify a Bullish Belt Hold pattern, traders should look for the following characteristics:
- Downtrend: The pattern typically emerges within an existing downtrend, indicating a potential reversal.
- Long Bullish Candlestick: The candlestick is predominantly bullish, indicating a surge in buying pressure. It opens near its low and closes near its high, suggesting strong bullish momentum.
- Little to No Lower Shadow: The bullish candlestick has little to no lower shadow, indicating that buyers have maintained control throughout the trading session.
- Confirmation: Confirmation of the pattern is sought through subsequent price action and additional technical indicators.
Interpreting Bullish Belt Hold:
The Bullish Belt Hold pattern suggests a quick turn from bearish to bullish in the market sentiment. It represents the fact that buyers have gained control and are dominating sellers. This pattern is interpreted by traders as a recommendation to either consider taking long positions or to tighten stop-loss levels on existing short positions.
Confirmation and Trading Strategies:
While the Bullish Belt Hold pattern provides a potential reversal signal, traders often seek additional confirmation before executing trades. They may consider factors such as:
- Volume Confirmation: Higher trading volume during the formation of the pattern adds credibility to the potential reversal.
- Resistance and Support Levels: Identify key resistance and support levels to further validate the pattern and potential price targets.
- Oscillators and Momentum Indicators: Combine the pattern with other technical indicators to strengthen the trading decision and identify oversold conditions.
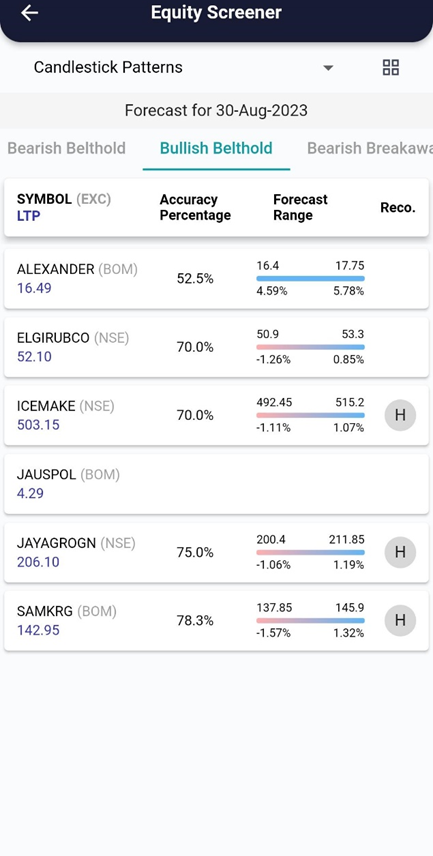
xCalData analyses the candles of individual stocks daily and identifies the stocks forming various patterns. Checkout xCalData app to know all the candle stick patterns formed by the stock of your interest.
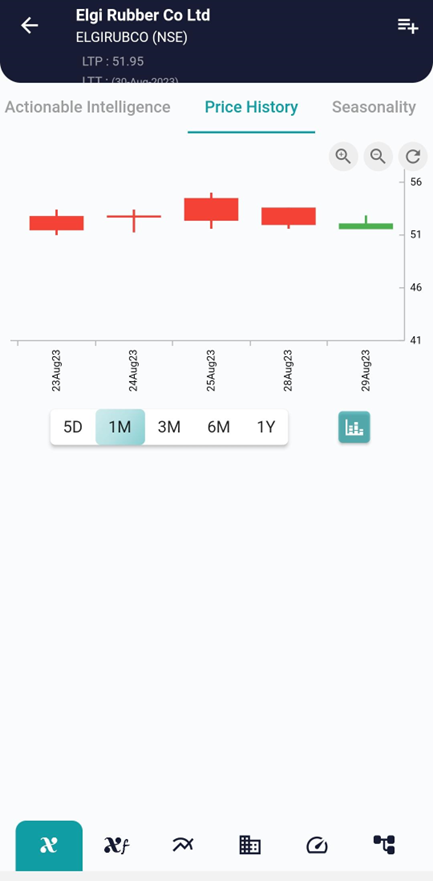
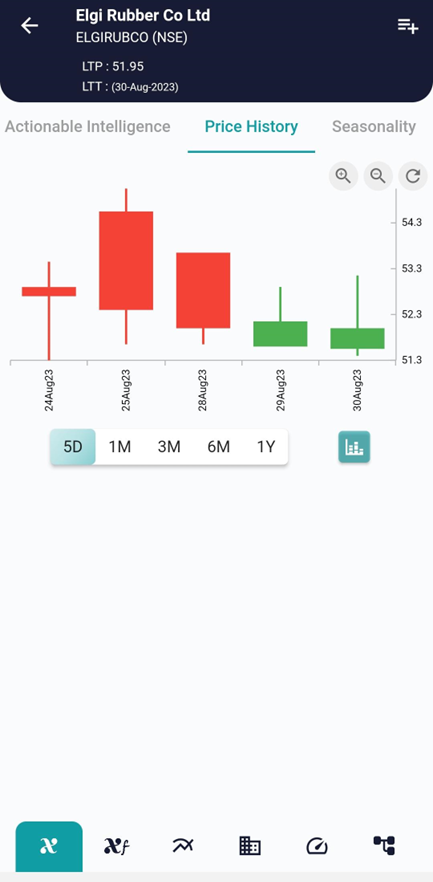
Example, on 29 Aug the stock showed the Bullish Belt Hold pattern and on 30 Aug the stock started going up as can be seen in the interpretation above.
Conclusion:
The Bullish Belt Hold pattern serves as a valuable tool for traders, providing insights into potential trend reversals and shifts in market sentiment. Understanding its characteristics and effectively identifying this pattern can enhance trading decisions.
However, it is important to note that no pattern guarantees success, and additional confirmation, risk management, and comprehensive analysis are essential for successful trading.
Trading always involves risk, and it is crucial to develop a well-rounded trading strategy, including risk management techniques, to increase your productivity and achieve long-term success in the financial markets, Visit and download xCalData.
Where can I see further insights on this stock?
xCalData offers unbiased insights into stocks. Download the app from google play. For Actionable Intelligence, subscribe to xCalData app on Android devices: Download here

Disclaimer: The securities quoted are for illustration only and are not recommendatory.
Popular Posts
-
Stock of Interest . August 23, 2024
#HSCL (NSE) Stock Report | 23 Aug 2024
-
Stock of Interest . August 23, 2024
Add Zerodha trading account to xCalData
-
Stock of Interest . August 23, 2024
What is xCalData , how to use it and how accurate is it?
-
Stock of Interest . August 23, 2024
Jurik Moving Average (JMA): A Profit Trading Insight