Candlestick Pattern
Posted On: September 22, 2023
Unlocking the Mystery of the Doji Star Candlestick Pattern in Trading
A Comprehensive Manual for Traders:
In the ever-evolving realm of financial markets, traders seek every advantage to gain insights into market sentiment and potential trend reversals. Candlestick patterns, with their visual representations, stand as indispensable tools for traders. Among these patterns, the “Doji Star” candlestick pattern holds a special place as a signal of market indecision. In this blog post, we will delve into the concept of the Doji Star candlestick pattern, unveil its unique characteristics, and discuss how traders can effectively identify and interpret it
The Doji Star is a two-candlestick pattern that combines the features of a traditional Doji with a preceding trend candle. It typically signifies a potential reversal in the market or a temporary pause in the prevailing trend. The central feature of the Doji Star is the small real body of the Doji itself, which reflects market uncertainty and indecision.
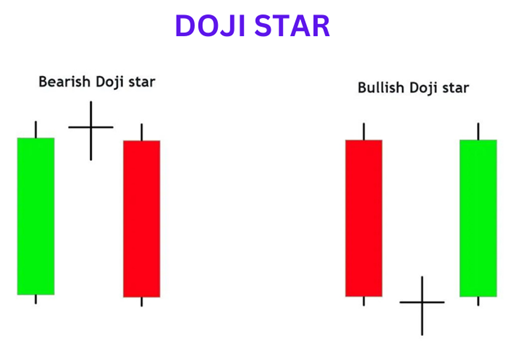
Characteristics of Doji Star:
To recognize the Doji pattern, traders should focus on the following key characteristics:
- Small Real Body: The Doji has a small real body, indicating little price difference between the opening and closing prices.
- Equal or Near-Equal Opening and Closing Prices: The opening and closing prices of the Doji candlestick are remarkably close to each other.
- Long Upper and Lower Shadows: Doji candles often have long upper and lower shadows, indicating that prices moved significantly higher and lower during the trading session.
- Context Matters: The Doji significance depends on its location within the price chart and the preceding price action. It’s essential to consider the context to interpret its meaning accurately.
Interpreting Doji Star:
To identify the Doji Star pattern, traders should focus on the following key elements:
- Preceding Trend: The pattern usually forms within the context of an existing trend, be it bullish or bearish.
- First Candle: The first candlestick is a strong, trend-confirming candle, indicating the prevailing market sentiment.
- Doji Candle: The second candlestick is a Doji, characterized by a small real body with opening and closing prices that are nearly identical.
- Gap: There is often a gap between the first candle and the Doji, signifying a potential change in sentiment.
Confirmation and Trading Strategies: To enhance the reliability of the Doji Star pattern, traders often seek additional confirmation through technical indicators or other patterns. This can include analyzing volume, considering support and resistance levels, and using complementary candlestick patterns. When confident in the signal, traders may consider opening or closing positions, always accompanied by sound risk management practices.
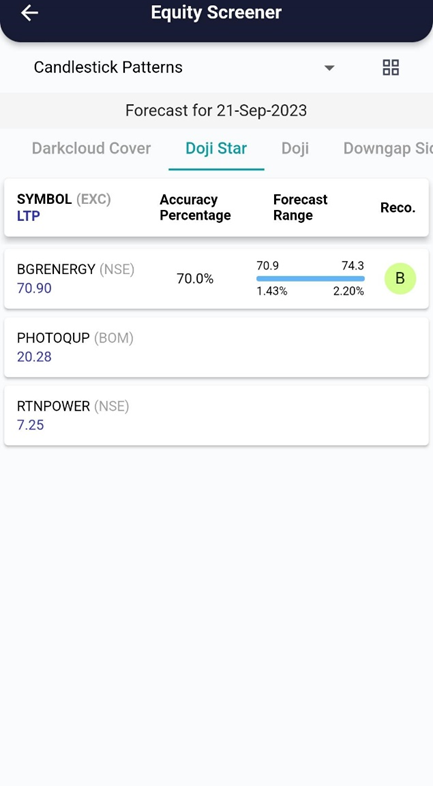
xCalData analyses the candles of individual stocks daily and identifies the stocks forming various patterns. Checkout xCalData app to know all the candle stick patterns formed by the stock of your interest.
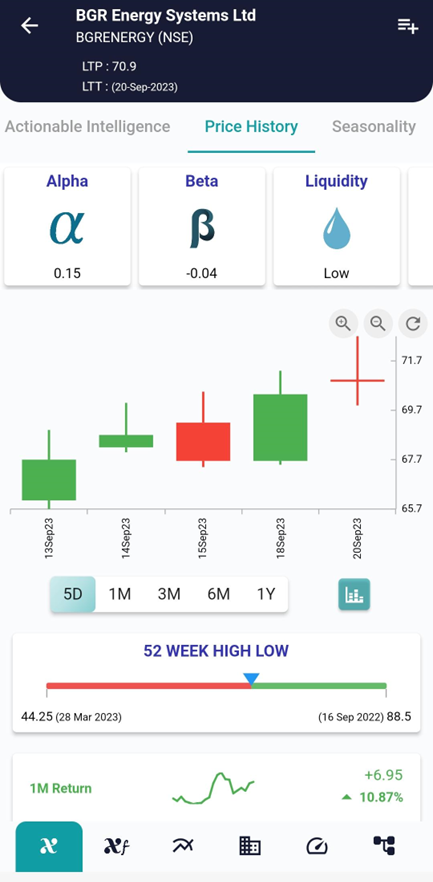
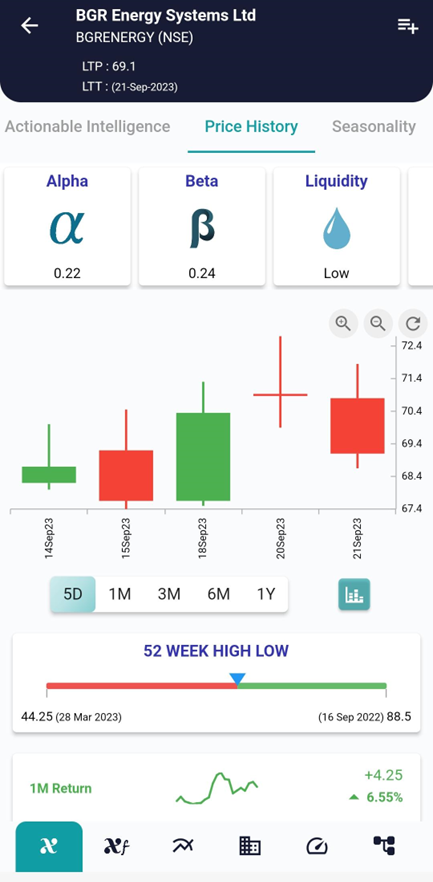
Example, on 20 Sep the stock showed the Shooting Star Candlestick Pattern and on 21 Sep the stock started going down as can be seen in the interpretation above.
Conclusion:
The Doji Star candlestick pattern is a valuable tool in the trader’s toolbox, offering insights into market indecision and potential trend reversals. However, like all trading signals, it should be used judiciously, in conjunction with comprehensive analysis and risk management strategies. Successful trading requires a deep understanding of candlestick patterns and the ability to adapt to changing market conditions.
Trading always involves risk, and it is crucial to develop a well-rounded trading strategy, including risk management techniques, to increase your productivity and achieve long-term success in the financial markets, Visit and download xCalData.
Where can I see further insights on this stock?
xCalData offers unbiased insights into stocks. Download the app from google play. For Actionable Intelligence, subscribe to xCalData app on Android devices: Download here

Disclaimer: The securities quoted are for illustration only and are not recommendatory.
Popular Posts
-
Stock of Interest . August 23, 2024
#HSCL (NSE) Stock Report | 23 Aug 2024
-
Stock of Interest . August 23, 2024
Add Zerodha trading account to xCalData
-
Stock of Interest . August 23, 2024
What is xCalData , how to use it and how accurate is it?
-
Stock of Interest . August 23, 2024
Jurik Moving Average (JMA): A Profit Trading Insight