Technical Indicator
Posted On: February 7, 2024
Unlocking the Power of RMA: A Comprehensive Guide to Mastering Trading Strategies
Introduction:
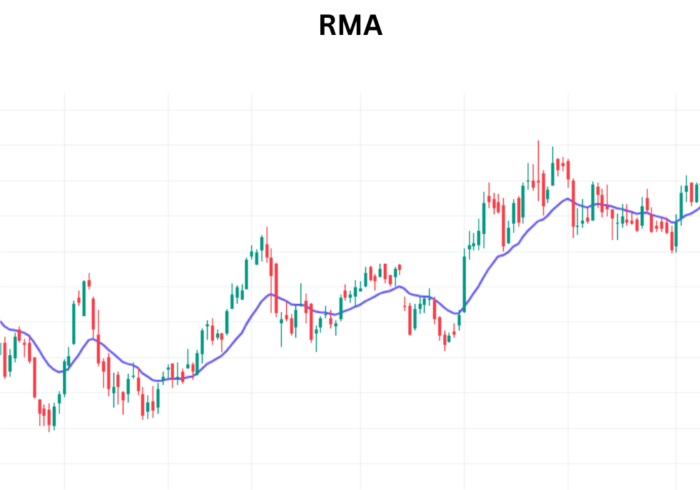
RMA (Wilder’s Smoothed Moving Average) is a distinctive technical indicator in the realm of technical analysis, offering a unique approach to smoothing price data. Developed by J. Welles Wilder, Jr., the RMA is akin to the Exponential Moving Average (EMA) but stands out with its deliberate response to price changes. In this comprehensive guide, we’ll explore the intricacies of RMA, its calculation, and how traders can effectively utilize it to generate buy and sell signals.

Understanding Wilder’s Smoothed Moving Average (RMA):
Wilder’s Smoothed Moving Average is designed to provide a smoothed representation of price data, minimizing the impact of short-term fluctuations. Compared to other moving averages, such as the Simple Moving Average (SMA) and EMA, the RMA responds more slowly to price changes. The calculation of RMA involves a smoothing process that results in a distinctive curve, offering traders an alternative perspective on trend analysis.
RMA Calculation:
The calculation of Wilder’s Smoothed Moving Average involves multiple steps:
- Calculate the Exponential Moving Average (EMA) for the desired period.
- Apply the smoothing formula to the EMA, considering the smoothing factor (usually expressed as a fraction).
- Repeat the process for subsequent periods, incorporating the latest price data.
The deliberate smoothing process in RMA allows it to maintain stability and reduce sensitivity to short-term price fluctuations.
Generating Buy and Sell Signals:
RMA provides valuable signals for traders, indicating potential shifts in market sentiment. Understanding these signals is crucial for effective decision-making:
Bullish Signal: A bullish signal occurs when the RMA value changes into a higher value from its previous point. This suggests a positive shift in the underlying trend, indicating potential buying opportunities.
Bearish Signal: Conversely, a bearish signal arises when the RMA value changes into a lower value from its previous point. This signals a potential shift in the trend to the downside, serving as an indication for selling or shorting positions.

Key Considerations for Trading with RMA:
To maximize the effectiveness of RMA in trading, consider the following key considerations:
- Confirmation with Other Indicators: RMA signals can be strengthened by confirming them with other technical indicators, such as trendlines, support and resistance levels, or complementary moving averages.
- Adjustment of Periods: Experiment with different periods for RMA to align with the desired timeframe for trading. Longer periods provide smoother trends but might lag in signaling changes, while shorter periods offer more responsiveness but may generate more noise.
- Market Conditions: Consider the prevailing market conditions, as RMA may perform differently in trending markets compared to ranging markets. Adapt your strategy based on the overall market environment.
- Risk Management: Always integrate proper risk management practices, including setting stop-loss orders and position sizing, to mitigate potential losses in case of unexpected market movements.
Conclusion:
Mastering Wilder’s Smoothed Moving Average (RMA) empowers traders with a unique tool for trend analysis and signal generation. Its deliberate response to price changes and distinctive smoothing process make it a valuable addition to the trader’s toolkit. By understanding the calculation of RMA and interpreting its buy and sell signals, traders can enhance their decision-making process and navigate the dynamic landscape of financial markets.
xCalData is an exceptional app available for Android devices that offers unbiased insights into stocks, allowing investors to make informed decisions. With its user-friendly interface and comprehensive features, xCalData provides a valuable resource for anyone interested in the stock market. Download the app from google play.
For Actionable Intelligence, subscribe to xCalData app on Android devices: https://tinyurl.com/downloadxCalData
Popular Posts
-
Stock of Interest . August 23, 2024
#HSCL (NSE) Stock Report | 23 Aug 2024
-
Stock of Interest . August 23, 2024
Add Zerodha trading account to xCalData
-
Stock of Interest . August 23, 2024
What is xCalData , how to use it and how accurate is it?
-
Stock of Interest . August 23, 2024
Jurik Moving Average (JMA): A Profit Trading Insight