Technical Indicator
Posted On: January 29, 2024
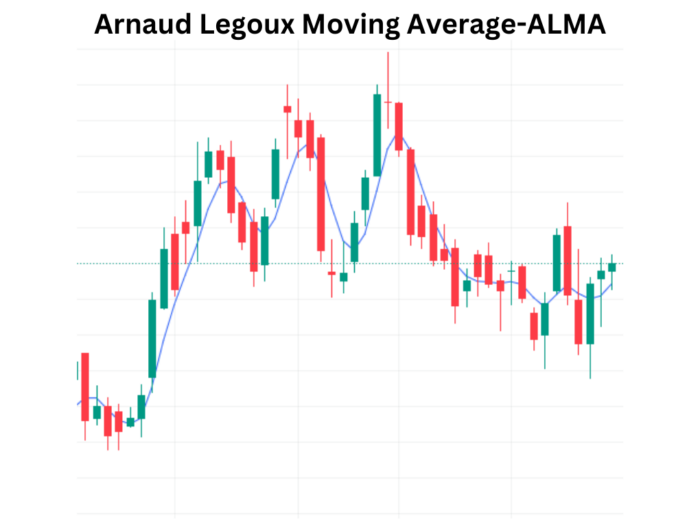
Unlocking Trading Insights with Arnaud Legoux Moving Average (ALMA)
In the intricate world of technical analysis, traders are always on the lookout for indicators that can provide accurate signals for spotting trends and potential reversals. The Arnaud Legoux Moving Average (ALMA) stands out as one such technical indicator , offering a unique approach to moving averages with improved accuracy and reduced noise. In this blog post, we’ll explore the foundation, calculations, and interpretation of ALMA, empowering traders to leverage its capabilities for more informed decision-making using in xCaldata App.
Introduction:
The Arnaud Legoux Moving Average (ALMA) is a technical indicator designed to address the limitations of traditional moving averages. By simultaneously calculating moving averages in opposite directions, ALMA aims to eliminate noise and enhance accuracy. ALMA shares the foundation of moving averages but introduces a novel approach to improve trend detection and reduce false signals.
Foundation and Pre-Calculations: Before delving into the calculations, let’s understand the foundational elements of ALMA:
Mathematical formula:
Pre-Calculations:
- m = distribution_offset * (length – 1)
- s = length / sigma
- wtd[i] = exp(-1 * ((i – m) * (i – m)) / (2 * s * s))
- for each i in the range [0, length)
Calculation of ALMA:
- For each i in the range [length, close.Size):
- Initialize window_sum = 0 and cum_sum = 0.
- For each j in the range [0, length):
- window_sum = window_sum + wtd[j] * close[i – j].
- cum sum = cum sum + wtd[j]
- Calculate ALMA value for index i as
ALMA = window sum / cum sum.
Interpretation:
The interpretation of ALMA involves observing the price movements in relation to the ALMA line. Key points to consider:
- Crossing from Above: If the price crosses the ALMA line from above, it might indicate the beginning of a downtrend, signaling a potential selling opportunity.
- Crossing from Below: Conversely, if the price crosses the ALMA from below, it could suggest the start of an uptrend, presenting a potential buying opportunity.
ALMA Trading Signals: Incorporating ALMA into a trading strategy involves considering the ‘ALMA_Value’ and ‘Adjusted Price.’ Trading signals can be generated as follows:
- Buy Signal: If yesterday’s ‘ALMA_Value’ is below yesterday’s ‘Adjusted Price,’ and the current ‘ALMA_Value’ is equal to or greater than the current ‘Adjusted Price,’ a “Buy” signal is assigned.
- Sell Signal: If yesterday’s ‘ALMA_Value’ is above yesterday’s ‘Adjusted Price,’ and the current ‘ALMA_Value’ is equal to or less than the current ‘Adjusted Price,’ a “Sell” signal is assigned.
- Hold Signal: If none of the above conditions are met, i.e., the corresponding value in ‘ALMA_Intpt’ is assigned as ‘Hold.’
Conclusion: Leveraging ALMA for Informed Trading:
The Arnaud Legoux Moving Average (ALMA) emerges as a powerful tool in a trader’s arsenal, offering enhanced accuracy and reduced noise in trend identification. As traders unlock the insights provided by ALMA, they gain a valuable resource for making well-informed decisions in the ever-evolving landscape of financial markets.
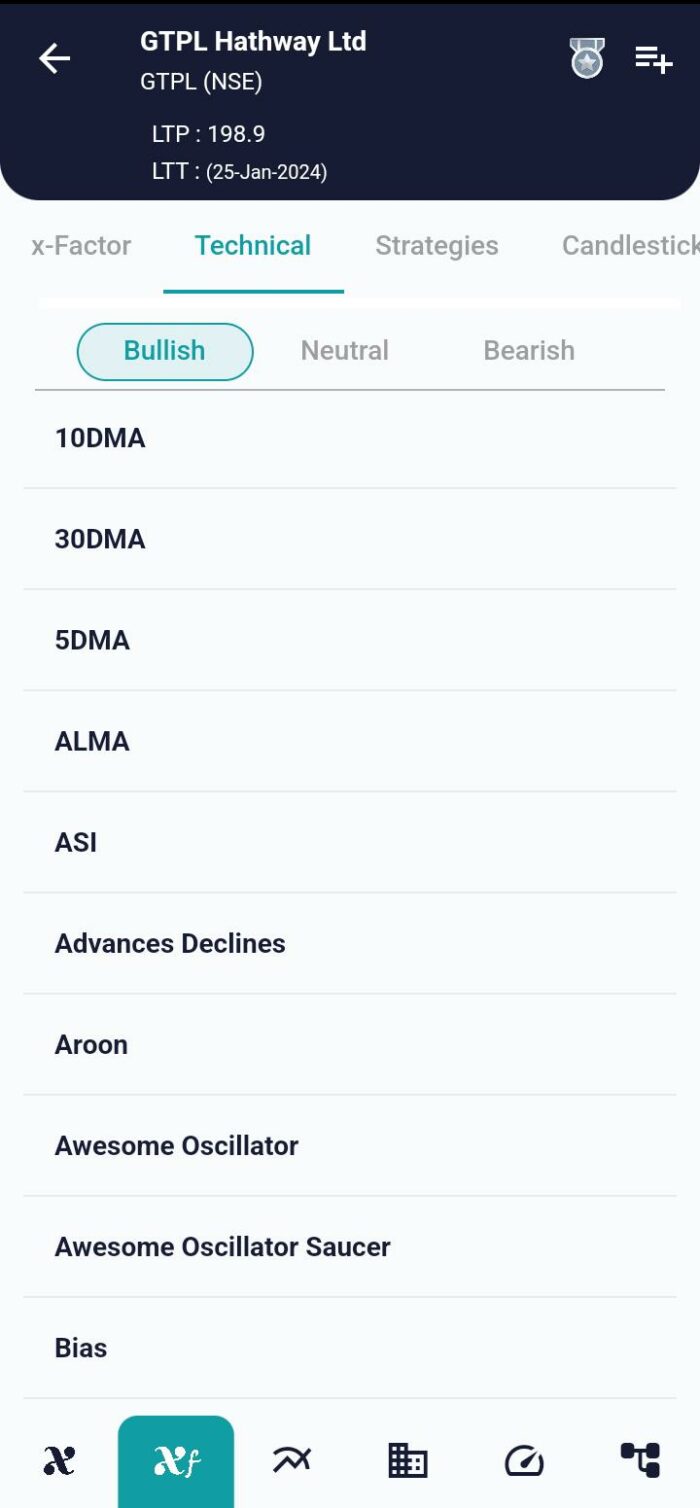
xCalData is an exceptional app available for Android devices that offers unbiased insights into stocks, allowing investors to make informed decisions. With its user-friendly interface and comprehensive features, xCalData provides a valuable resource for anyone interested in the stock market. Download the app from google play.
For Actionable Intelligence, subscribe to xCalData app on Android devices: https://tinyurl.com/downloadxCalData
Popular Posts
-
Stock of Interest . August 23, 2024
#HSCL (NSE) Stock Report | 23 Aug 2024
-
Stock of Interest . August 23, 2024
Add Zerodha trading account to xCalData
-
Stock of Interest . August 23, 2024
What is xCalData , how to use it and how accurate is it?
-
Stock of Interest . August 23, 2024
Jurik Moving Average (JMA): A Profit Trading Insight