Technical Indicator
Posted On: February 7, 2024
Unraveling Success with the Price-Volume Indicator (PVOL)
Introduction:
In the intricate realm of stock market analysis, understanding the interplay between price movements and trading volume is crucial for gaining insights into market dynamics. The Price-Volume technical indicator (PVOL) emerges as a valuable tool, shedding light on sudden changes in the market and providing traders with a nuanced perspective. This guide explores the significance of PVOL, how it’s calculated, and its application in identifying strong trends.
Unveiling the Price-Volume Indicator (PVOL):
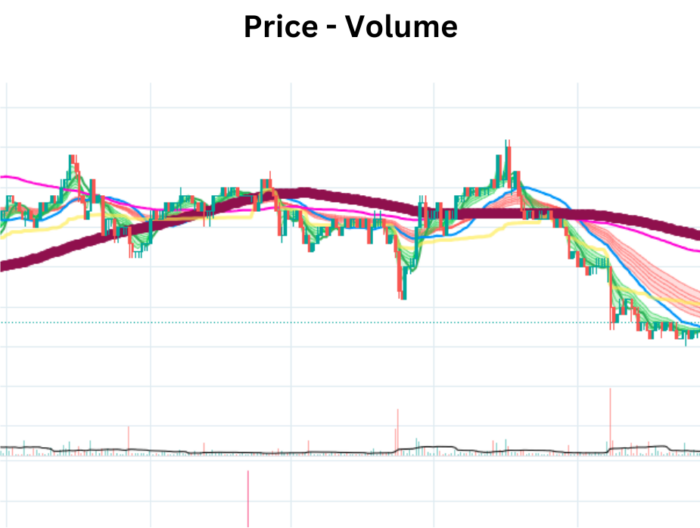
The Price-Volume Indicator, denoted as PVOL, serves as a bridge between price movements and trading volume. By multiplying the current price by its corresponding trading volume, PVOL captures the intensity of market activity, offering a comprehensive view of sudden changes and potential trend strengths.
Understanding Price-Volume Signals:
Strong Trend Signal:
- Highest PVOL Value in the Past 30 Days: If today’s PVOL value surpasses the highest observed over the past 30 days, it signals a Strong Trend.
Interpreting PVOL for Market Dynamics:
- Market Activity Intensity:
- Price-Volume reflects the intensity of market activity, with higher values indicating periods of heightened interest and potentially stronger trends.
- Identification of Sudden Changes:
- Sudden spikes in Price-Volume can be indicative of abrupt changes in market sentiment, providing traders with timely cues to reassess their positions.
- Confirmation of Trend Strength:
- The highest Price-Volume value over the past 30 days acts as a benchmark for assessing the strength of the current trend, aiding traders in confirming or reevaluating their stance.
Strategies for Implementation:
- Trend Confirmation:
- Use PVOL to confirm the strength of an ongoing trend by comparing the current PVOL value with the highest observed value in the past 30 days.
- Early Identification of Market Shifts:
- Monitor PVOL for sudden spikes or deviations from the norm, as these can signal potential market shifts or reversals.
- Risk Management:
- Incorporate PVOL insights into risk management strategies, adjusting positions or implementing protective measures in response to significant changes in market dynamics.
Conclusion:
The Price-Volume Indicator (PVOL) serves as a valuable ally for traders seeking to unravel the intricacies of market dynamics. By blending price and volume data, PVOL offers a unique perspective on sudden changes and trend strengths, empowering traders to make well-informed decisions in the dynamic landscape of the stock market.
xCalData is an exceptional app available for Android devices that offers unbiased insights into stocks, allowing investors to make informed decisions. With its user-friendly interface and comprehensive features, xCalData provides a valuable resource for anyone interested in the stock market. Download the app from google play.
For Actionable Intelligence, subscribe to xCalData app on Android devices: https://tinyurl.com/downloadxCalData
Popular Posts
-
Stock of Interest . August 23, 2024
#HSCL (NSE) Stock Report | 23 Aug 2024
-
Stock of Interest . August 23, 2024
Add Zerodha trading account to xCalData
-
Stock of Interest . August 23, 2024
What is xCalData , how to use it and how accurate is it?
-
Stock of Interest . August 23, 2024
Jurik Moving Average (JMA): A Profit Trading Insight