Candlestick Pattern
Posted On: July 24, 2023
Unravelling the Bearish Engulfing Pattern
A Comprehensive Guide to Spotting and Interpreting Bearish Trend Reversals in Candlestick Analysis
In the realm of financial markets, traders employ various techniques to analyze price patterns and make informed trading decisions. Candlestick patterns play a crucial role in this analysis, providing valuable insights into market sentiment. One such pattern is the “Bearish Engulfing,” which signifies a potential trend reversal towards a bearish direction. In this blog post, we will delve into the concept of bearish engulfing patterns, explore their characteristics, and discuss how traders can identify and interpret them.
The Bearish Engulfing pattern is a two-candlestick formation that typically occurs during an uptrend. It signifies that the bulls’ control might be weakening, potentially leading to a bearish reversal. The pattern consists of a bullish candlestick followed by a larger bearish candlestick that “engulfs” the previous day’s bullish candlestick, overshadowing it completely.

Characteristics of Bearish Engulfing:
To identify a bearish engulfing pattern, it is important to understand its key characteristics:
- Uptrend: The pattern usually emerges in an ongoing uptrend, indicating a potential reversal.
- Small bullish candlestick: The first candlestick in the pattern is a smaller-bodied bullish candlestick, signifying buying pressure but with limited control.
- Larger bearish candlestick: The second candlestick is a larger-bodied bearish candlestick that engulfs the entire range of the previous candle, suggesting increased selling pressure and potential dominance of the bears.
Interpreting Bearish Engulfing:
Bearish engulfing patterns are significant because they represent a shift in market sentiment, indicating that bears may be taking control. Traders interpret this pattern as a signal that the previous uptrend might be losing momentum and a potential reversal towards a bearish trend may occur.
Confirmation and Trading Strategies:
While the Bearish Engulfing pattern serves as a potential bearish signal, traders often seek additional confirmation before executing trades. They may consider the following factors:
- Volume Confirmation: Higher trading volume during the formation of the pattern enhances the credibility of the potential reversal.
- Support and Resistance Levels: Identifying key support and resistance levels can validate the pattern and assist in setting realistic price targets.
- Technical Indicators: Combining the Bearish Engulfing pattern with other technical indicators, such as moving averages or oscillators, enriches the trading decision-making process.
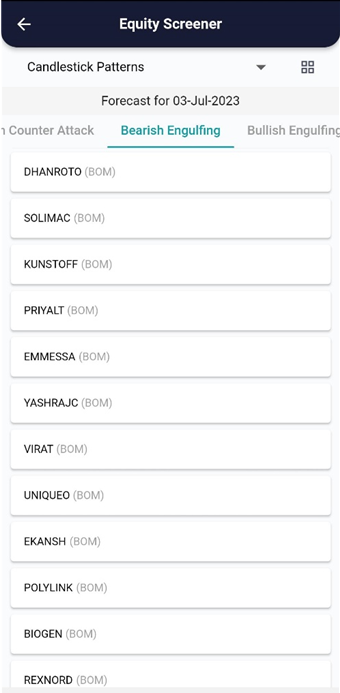
xCalData analyses the candles of individual stocks daily and identifies the stocks forming various patterns. Checkout xCalData app to know all the candle stick patterns formed by the stock of your interest.
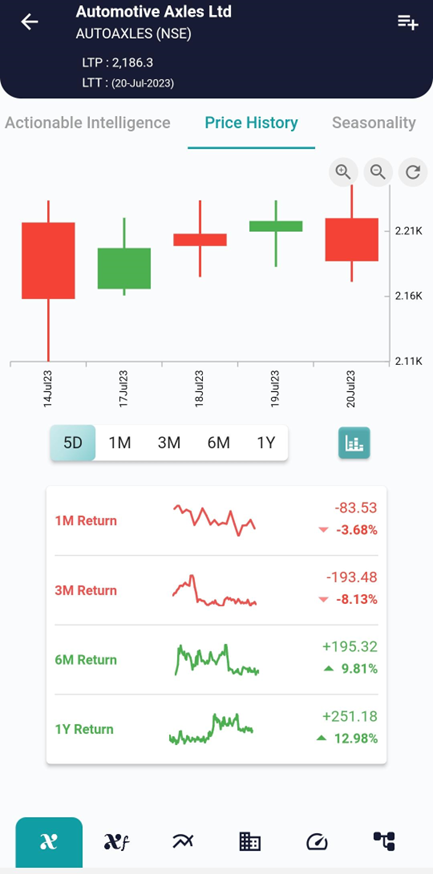
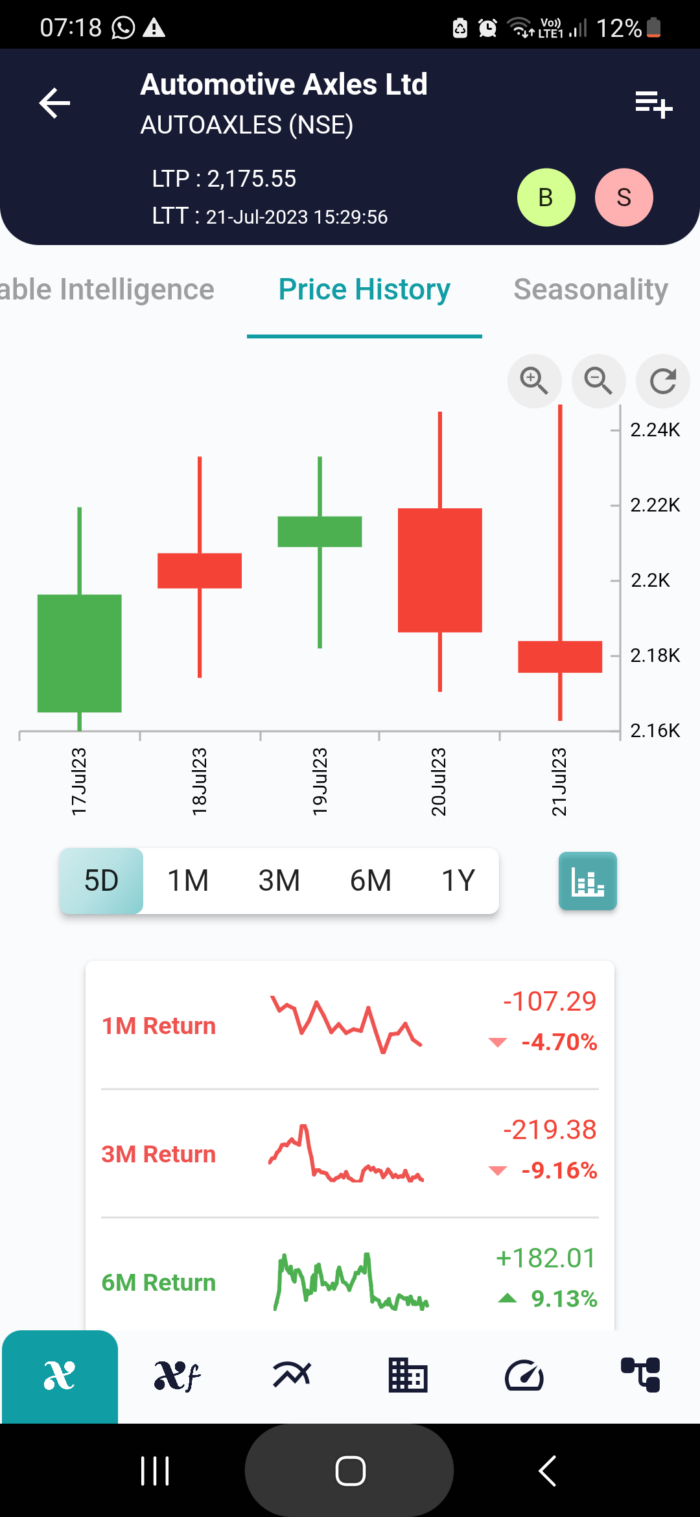
Example, on 20 July the stock showed the bearish engulf pattern and on 21 the stock started going down as can be seen in the charts above.
Conclusion:
Bearish engulfing patterns serve as essential tools for traders, providing insights into potential trend reversals and shifts in market sentiment. Understanding the characteristics and identifying these patterns can assist traders in making informed decisions.
However, it is important to remember that no single indicator or pattern guarantees accurate predictions in the dynamic world of trading. Therefore, combining bearish engulfing patterns with other technical analysis tools and risk management strategies is recommended for success in the financial markets.
Trading always involves risk, and it is crucial to develop a well-rounded trading strategy, including risk management techniques, to increase your productivity and achieve long-term success in the financial markets, Visit and download xCalData.
Where can I see further insights on this stock?
xCalData offers unbiased insights into stocks. Download the app from google play. For Actionable Intelligence, subscribe to xCalData app on Android devices: Download here

Disclaimer: The securities quoted are for illustration only and are not recommendatory.
Popular Posts
-
Stock of Interest . August 23, 2024
#HSCL (NSE) Stock Report | 23 Aug 2024
-
Stock of Interest . August 23, 2024
Add Zerodha trading account to xCalData
-
Stock of Interest . August 23, 2024
What is xCalData , how to use it and how accurate is it?
-
Stock of Interest . August 23, 2024
Jurik Moving Average (JMA): A Profit Trading Insight