Candlestick Pattern
Posted On: September 1, 2023
Unravelling the Hanging Man Candlestick Pattern in Trading
A Comprehensive Manual for Traders:
In the world of technical analysis, candlestick patterns play a crucial role in providing traders with valuable insights into market sentiment and potential trend reversals. One such significant pattern is the Hanging Man, which holds importance for traders seeking bearish signals. In this blog post, we will explore the characteristics of the Hanging Man pattern, explain how traders can identify and interpret it, and delve into its implications for trading strategies.
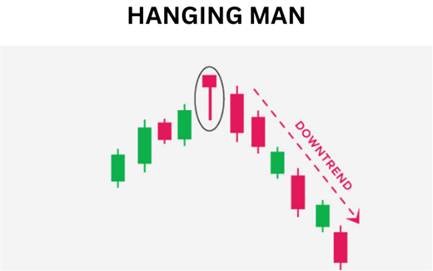
The Hanging Man represents a single candlestick pattern that indicates a possible trend reversal from bullish to bearish. This pattern is characterized by a small body situated at the top of the candlestick, a long lower shadow, and minimal to no upper shadow.
Identifying the Hanging Man Pattern:
To identify the Hanging Man pattern, traders should focus on the following key features:
- Small Body: The candlestick displays a small body, reflecting a narrow trading range between the opening and closing prices.
- Long Lower Shadow: The presence of a significant lower shadow suggests substantial price decline during the trading session.
- Minimal to No Upper Shadow: The absence of an upper shadow or its minimal length indicates that buyers struggled to push the price higher during the session.
- Confirmation: Like all candlestick patterns, traders are advised to seek confirmation of the Hanging Man through additional technical analysis techniques or complementary bearish indicators.
Interpreting the Hanging Man Pattern:
The Hanging Man pattern indicates a potential shift in market sentiment from bullish to bearish. It suggests that despite a higher open, sellers managed to drive prices lower during the session, hinting at a weakening of bullish momentum.
Confirmation and Trading Strategies:
While the Hanging Man pattern provides a potential bearish signal, traders often seek additional confirmation before executing trades. The following factors can contribute to this confirmation:
- Volume Confirmation: Higher trading volume accompanying the pattern’s formation bolsters the validity of the potential trend reversal.
- Support and Resistance Levels: Identifying key support and resistance levels can further validate the pattern and aid in establishing appropriate price targets.
- Technical Indicators: Combining the Hanging Man pattern with other technical indicators, such as moving averages or RSI, can provide supplementary confirmation and enhance trading decisions.
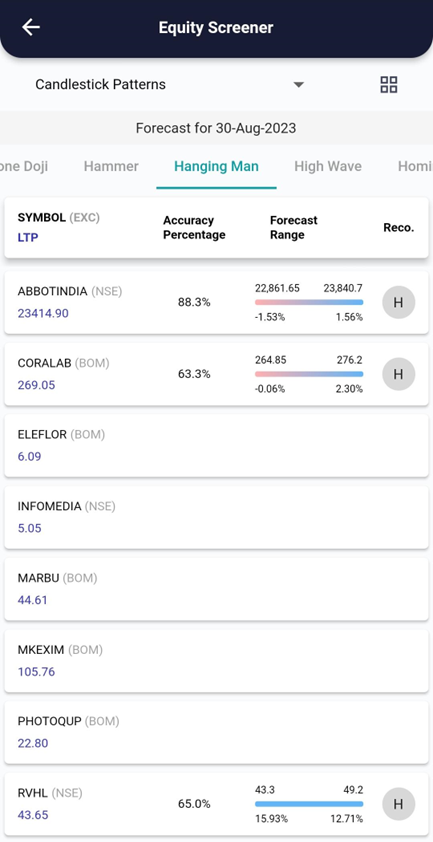
xCalData analyses the candles of individual stocks daily and identifies the stocks forming various patterns. Checkout xCalData app to know all the candle stick patterns formed by the stock of your interest.
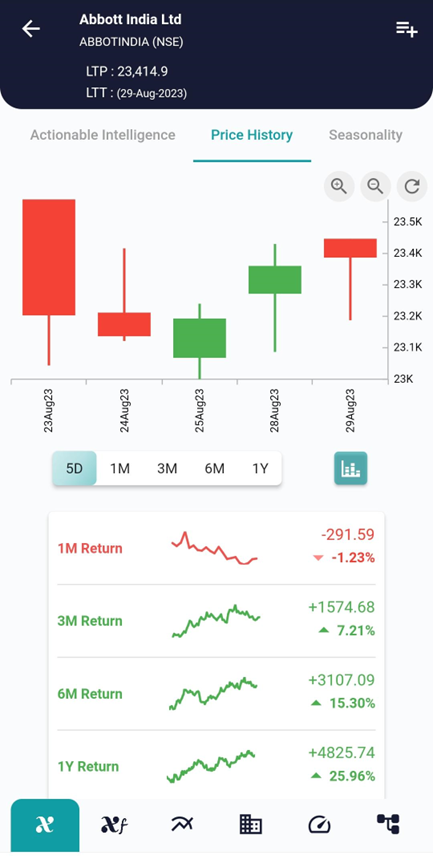
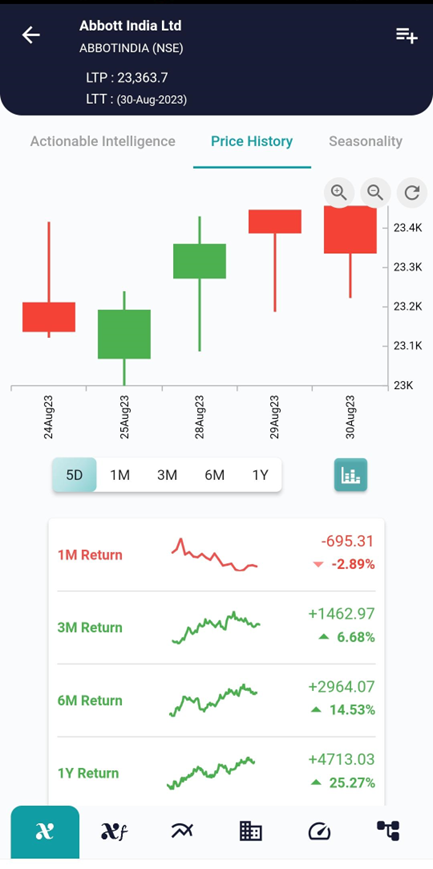
Example, on 29 Aug the stock showed the Hanging Man pattern and on 30 Aug the stock started going down as can be seen in the interpretation above.
Conclusion:
The Hanging Man pattern serves as a valuable tool for traders, offering insights into potential trend reversals from bullish to bearish. By comprehending its characteristics and skilfully identifying this pattern, traders can refine their trading strategies.
However, it is essential to acknowledge that no pattern guarantees success, and additional confirmation and thorough analysis are necessary for making well-informed trading decisions.
Trading always involves risk, and it is crucial to develop a well-rounded trading strategy, including risk management techniques, to increase your productivity and achieve long-term success in the financial markets, Visit and download xCalData.
Where can I see further insights on this stock?
xCalData offers unbiased insights into stocks. Download the app from google play. For Actionable Intelligence, subscribe to xCalData app on Android devices: Download here

Disclaimer: The securities quoted are for illustration only and are not recommendatory.
Popular Posts
-
Stock of Interest . August 23, 2024
#HSCL (NSE) Stock Report | 23 Aug 2024
-
Stock of Interest . August 23, 2024
Add Zerodha trading account to xCalData
-
Stock of Interest . August 23, 2024
What is xCalData , how to use it and how accurate is it?
-
Stock of Interest . August 23, 2024
Jurik Moving Average (JMA): A Profit Trading Insight