Technical Indicator
Posted On: February 5, 2024
Unveiling Hull Moving Average (HMA) Indicator: A Revolutionary Moving Average
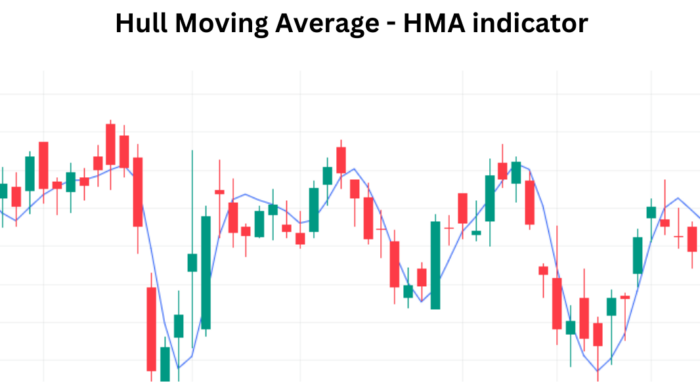
In the dynamic realm of technical analysis, traders are always on the lookout for tools that offer precision and reliability. The Hull Moving Average (HMA technical indicator ) stands out as a distinctive indicator designed to address the shortcomings of traditional moving averages. Crafted by Alan Hull in 2005, the HMA combines the strengths of Simple Moving Averages (SMA), Weighted Moving Averages (WMA), and Exponential Moving Averages (EMA), promising a smoother and more responsive performance. Let’s embark on a journey to unravel the intricacies of HMA and discover how it can elevate your trading strategies.

Understanding Hull Moving Average Indicator: The Essence of Smoothness
1. HMA Calculation:
- The Hull Moving Average Indicator is calculated by combining the weighted aspects of SMAs, WMAs, and EMAs.
- The unique formula ensures a balance between responsiveness and reduced noise.
2. Parameters and Timeframes:
- Customization: Traders can tailor Hull Moving Average Indicator parameters to align with their trading preferences.
- Timeframe Selection: Adapt HMA Indicator to different timeframes based on your trading style and objectives.
Interpreting Hull Moving Average Signals: Your Guide to Action
1. Bullish Signal: Rising Hull Moving Average Value
- Interpretation: An ascending HMA Indicator value suggests a potential uptrend in prices.
- Buy Signal: Traders may consider initiating or holding long positions.

2. Bearish Signal: Falling Hull Moving Average Value
- Interpretation: A descending HMA Indicator value indicates a possible downtrend.
- Sell Signal: Traders might contemplate short positions or managing existing shorts.
3. Customized Strategies:
- Confirmation with Other Indicators: Strengthen HMA signals by corroborating with additional indicators.
- Dynamic Adjustments: Modify HMA parameters based on evolving market conditions.
Integrating HMA into Your Trading Routine
1. Risk Management:
- Incorporate HMA signals into your risk management strategy.
- Set stop-loss and take-profit levels based on HMA insights to optimize risk-reward ratios.
2. Backtesting and Optimization:
- Validate HMA effectiveness through backtesting.
- Fine-tune parameters for optimal performance in different market scenarios.
HMA in Action: Practical Insights
Let’s explore a hypothetical scenario to witness HMA in action:
- Scenario:
- Rising HMA Value: Over a specified period, HMA values exhibit an upward trajectory.
- Interpretation: Traders may interpret this as a bullish signal, anticipating a continued uptrend.
- Action: Consider holding or entering long positions.
- Scenario:
- Falling HMA Value: HMA values show a consistent decline.
- Interpretation: Traders might view this as a bearish signal, suggesting a potential downtrend.
- Action: Evaluate potential short positions or manage existing shorts.
Conclusion: Mastering HMA for Trading Success
As you embark on your journey through the vast landscape of technical analysis, integrating the Hull Moving Average (HMA) into your toolkit can bring newfound clarity and precision to your trading decisions. Alan Hull’s innovative creation offers a unique blend of responsiveness and smoothness, making it a valuable asset for traders across diverse market conditions. Whether you’re a seasoned professional or a budding enthusiast, harnessing the power of HMA can be a game-changer, elevating your trading strategies to new heights of success.
xCalData is an exceptional app available for Android devices that offers unbiased insights into stocks, allowing investors to make informed decisions. With its user-friendly interface and comprehensive features, xCalData provides a valuable resource for anyone interested in the stock market. Download the app from google play.
For Actionable Intelligence, subscribe to xCalData app on Android devices: https://tinyurl.com/downloadxCalData
Popular Posts
-
Stock of Interest . August 23, 2024
#HSCL (NSE) Stock Report | 23 Aug 2024
-
Stock of Interest . August 23, 2024
Add Zerodha trading account to xCalData
-
Stock of Interest . August 23, 2024
What is xCalData , how to use it and how accurate is it?
-
Stock of Interest . August 23, 2024
Jurik Moving Average (JMA): A Profit Trading Insight