Strategy
Posted On: January 25, 2024
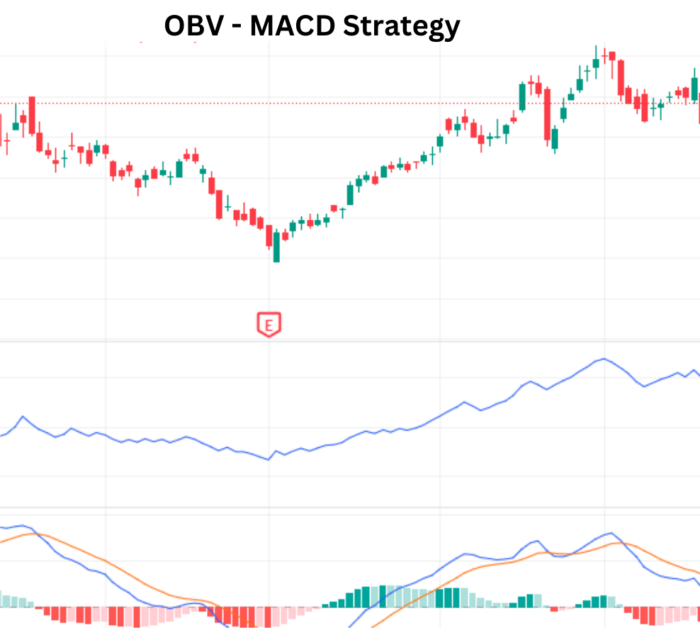
Unveiling Market Dynamics: OBV – MACD Strategy
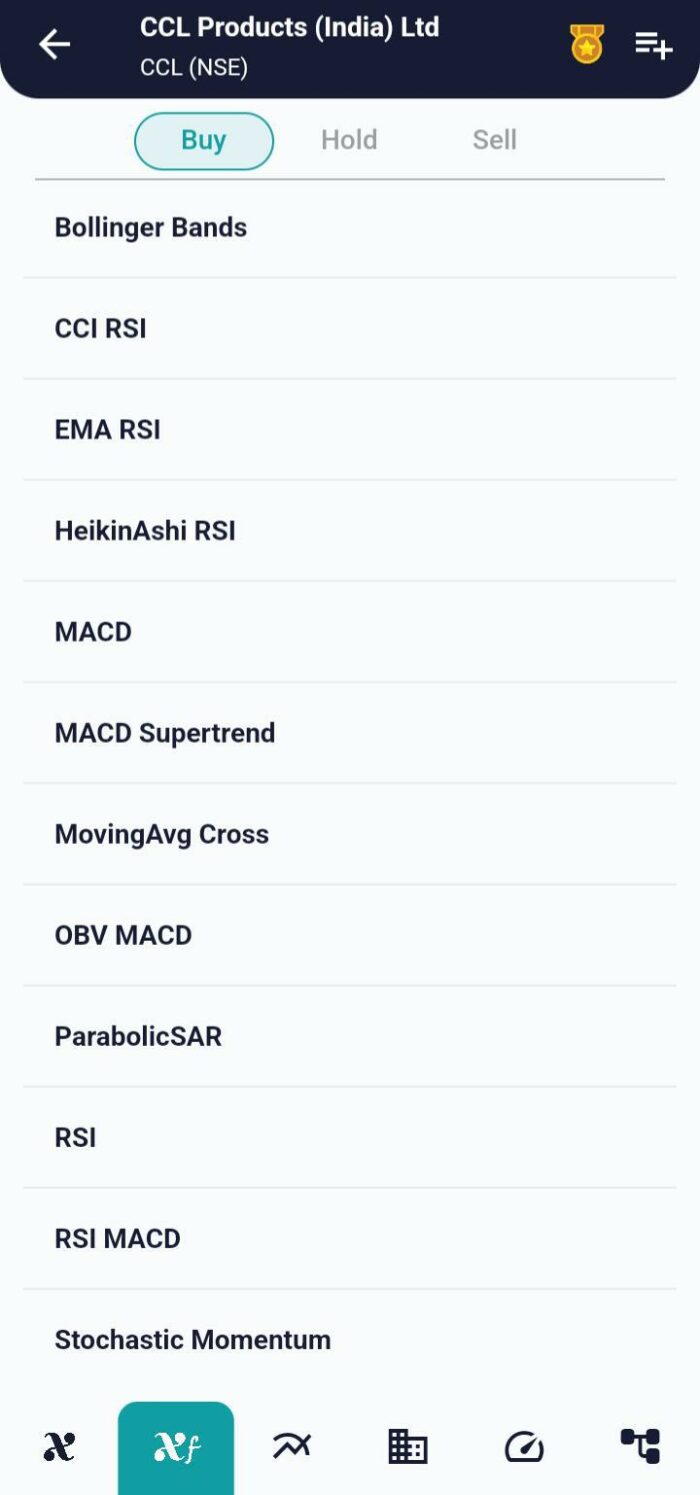
In the dynamic realm of financial markets, traders constantly seek strategies that offer comprehensive insights into market movements. The OBV – MACD Strategy, a fusion of the On-Balance Volume (OBV) and Moving Average Convergence Divergence (MACD) indicators, stands as a robust tool for traders. By integrating the volume analysis from OBV with the momentum insights from MACD, this strategy aims to provide a comprehensive approach to identifying potential buy and sell signals. While the strategy demonstrates good accuracy, traders are reminded to exercise caution and manage risks effectively. In this blog post, we explore the intricacies of the OBV – MACD Strategy, including the indicators, datasets, parameters, and the conditions triggering buy and sell signals by using the xCaldata App.
Understanding the OBV – MACD Strategy
The OBV – MACD Strategy capitalizes on the synergies between the OBV indicator, which gauges buying and selling pressure through volume analysis, and the MACD indicator, which measures the momentum of price movements. By combining these indicators, the strategy aims to offer traders a holistic approach to understanding market dynamics.
Key Indicators in the Strategy
- On-Balance Volume (OBV): OBV measures the cumulative buying and selling pressure by adding or subtracting volume based on price movements. Rising OBV indicates buying pressure, while falling OBV suggests selling pressure.
- Moving Average Convergence Divergence (MACD): MACD is a trend-following momentum indicator that calculates the difference between two exponential moving averages (EMA). The MACD signal line is the EMA of the MACD line.
Essential Datasets for Implementation
To implement the OBV – MACD Strategy effectively, traders rely on three crucial datasets:
- Technical Data: This dataset includes various technical indicators, with a focus on OBV and MACD values. Technical analysis forms the backbone of the strategy.
- Price Data: Essential for calculating indicators and identifying buy/sell signals, price data provides information on opening, closing, high, and low prices.
- Calendar Data: Timely market events and economic releases are essential for understanding broader market dynamics and enhancing decision-making.
Key Parameters Guiding the Strategy
The successful execution of the OBV – MACD Strategy hinges on specific parameters:
- Previous Technical Data: Access to the previous 2 days’ technical data is crucial for trend analysis and signal generation that includes these two indicators.
- OBV Value: Defining the trend based on OBV helps identify buying or selling pressure in the market.
- MACD Interpretation Value: Understanding the significance of the MACD signal line provides insights into the momentum of price movements.
Buy and Sell Conditions
Buy:
- Initiate a buy position when OBV is in an uptrend, indicating accumulating buying pressure, and there is a bullish crossover in the MACD, signaling potential upward momentum.
Sell:
- Execute a sell position when OBV is in a downtrend, suggesting increasing selling pressure, and there is a bearish crossover in the MACD, indicating potential downward momentum.
Conclusion: Navigating Market Momentum
In conclusion, the OBV – MACD Strategy empowers traders with a powerful tool for navigating market momentum. By synergizing the insights from OBV and MACD, traders gain a comprehensive understanding of potential shifts in buying and selling pressure. However, given the inherent risks, traders are advised to approach this strategy with caution and implement effective risk management strategies. As the OBV – MACD Strategy becomes an integral part of a trader’s toolkit, it enhances precision and offers valuable insights in the ever-changing landscape of financial markets.
xCalData is an exceptional app available for Android devices that offers unbiased insights into stocks, allowing investors to make informed decisions. With its user-friendly interface and comprehensive features, xCalData provides a valuable resource for anyone interested in the stock market. Download the app from google play store.
For Actionable Intelligence, subscribe to xCalData app on Android devices: https://tinyurl.com/downloadxCalData
Popular Posts
-
Stock of Interest . August 23, 2024
#HSCL (NSE) Stock Report | 23 Aug 2024
-
Stock of Interest . August 23, 2024
Add Zerodha trading account to xCalData
-
Stock of Interest . August 23, 2024
What is xCalData , how to use it and how accurate is it?
-
Stock of Interest . August 23, 2024
Jurik Moving Average (JMA): A Profit Trading Insight