Technical Indicator
Posted On: February 6, 2024
Unveiling Market Dynamics with the Pretty Good Oscillator (PGO)
Introduction:
In the ever-evolving landscape of financial markets, traders constantly seek tools to enhance their decision-making processes. The Pretty Good Oscillator (PGO), conceptualized by Mark Johnson, emerges as a valuable technical indicator designed to measure the proximity between the current close and its N-day simple moving average. In this article, we delve into the intricacies of the PGO and explore how traders can interpret its signals for strategic insights.
Understanding the Pretty Good Oscillator (PGO):
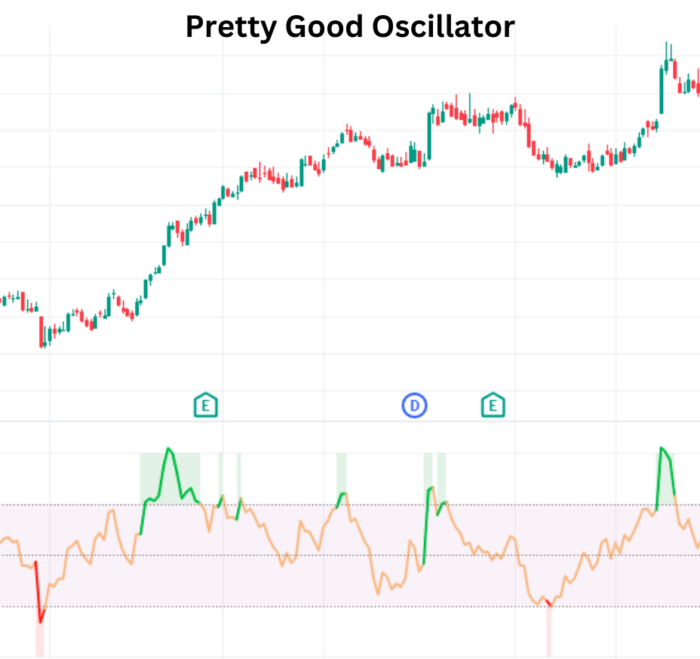
The Pretty Good Oscillator is a unique indicator that leverages the average true range (ATR) to gauge the distance between the present close and its N-day simple moving average. By incorporating volatility into its calculations, the PGO aims to provide traders with a comprehensive view of market dynamics.
Interpreting PGO Signals:
Traders can derive valuable insights from the PGO by analyzing its signals in different market scenarios. Here’s a breakdown of how to interpret PGO signals:
- Zero-line Crossover Signals:
- Buy Signal: When the PGO crosses the 0 value on the way up.
- Sell Signal: When the PGO crosses the 0 value on the way down.
- Hold: When the PGO is not crossing the 0 value.
- Overbought or Oversold Conditions:
- Overbought: If the PGO Value is greater than 2.
- Oversold: If the PGO Value is less than -2.
- Neutral: If the PGO Value ranges between -2 to 2.
- Divergence Analysis:
- Bullish Divergence: When the price makes a lower low, but the PGO forms a higher low, signaling a potential Buy.
- Bearish Divergence: When the price makes a higher high, but the PGO forms a lower high, indicating a potential Sell.
- Hold: In the absence of divergence patterns.
Incorporating PGO into Trading Strategies:
- Trend Confirmation: Traders use PGO signals to confirm prevailing trends. Aligning PGO crossovers with the overall trend enhances the reliability of signals.
- Dynamic Risk Management: Understanding overbought and oversold conditions assists traders in managing risk exposure. PGO signals can serve as a guide for adjusting positions based on market extremes.
- Divergence-Based Strategies: Bullish and bearish divergences identified by the PGO can be integral to developing strategies that capitalize on potential trend reversals.
Conclusion:
The Pretty Good Oscillator, with its emphasis on measuring proximity to moving averages and incorporating volatility, offers traders a versatile tool for market analysis. Whether confirming trends, assessing market extremes, or spotting divergence patterns, the PGO enriches the decision-making process. Traders can harness the power of the Pretty Good Oscillator to navigate the complexities of financial markets with greater confidence and precision.
xCalData is an exceptional app available for Android devices that offers unbiased insights into stocks, allowing investors to make informed decisions. With its user-friendly interface and comprehensive features, xCalData provides a valuable resource for anyone interested in the stock market. Download the app from google play.
For Actionable Intelligence, subscribe to xCalData app on Android devices: https://tinyurl.com/downloadxCalData
Popular Posts
-
Stock of Interest . August 23, 2024
#HSCL (NSE) Stock Report | 23 Aug 2024
-
Stock of Interest . August 23, 2024
Add Zerodha trading account to xCalData
-
Stock of Interest . August 23, 2024
What is xCalData , how to use it and how accurate is it?
-
Stock of Interest . August 23, 2024
Jurik Moving Average (JMA): A Profit Trading Insight