Technical Indicator
Posted On: January 30, 2024
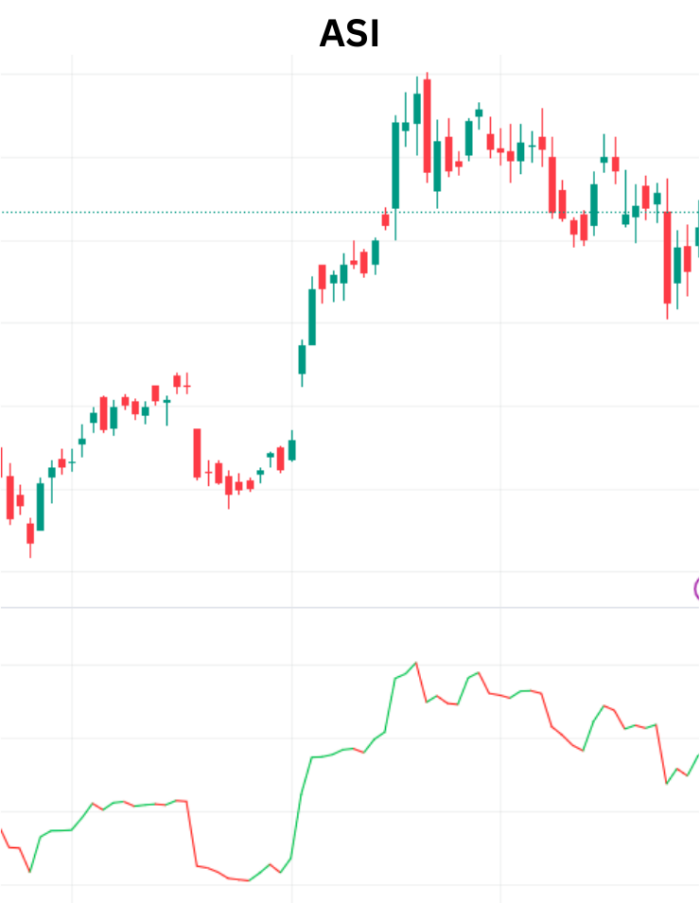
Unveiling the Accumulative Swing Index (ASI): Deciphering Trends in Financial Markets
In the intricate realm of financial markets, technical traders employ a multitude of indicators to decode price trends and make informed decisions. One such powerful tool is the Accumulative Swing Index (ASI), a modified version of J. Welles Wilder’s swing index. Developed to offer a more comprehensive understanding of long-term trends, the ASI technical indicator leverages candlestick charts, integrating opening, closing, high, and low prices. In this exploration, we will delve into the intricacies of the ASI, unraveling its key components, calculations, and practical applications.
Understanding ASI:
The Accumulative Swing Index is designed to provide a nuanced long-term perspective on a security’s price trends. Unlike the plain swing index, which relies on daily price points, the ASI considers a broader spectrum of data, offering a more holistic view. If the long-term trend is upward, the ASI presents as a positive value, indicating strength. Conversely, in a downtrend, the ASI manifests as a negative value.
Mathematical Formulas:
The ASI is derived from the Swing Index, a value calculated using a complex equation that involves open, close, high, and low prices. The Swing Index (SI) is computed as follows:
SI=50 × (C – Cy + 0.5 * (C – O) + 0.25 × (Cy – Oy)) / R
Where:
- SI is the Swing Index.
- C is today’s closing price.
- Cy is yesterday’s closing price.
- Hy is yesterday’s highest price.
- Ly is yesterday’s lowest price.
- Oy is yesterday’s opening price.
- R varies based on relationships between C, Hy, and Ly.
- K is the larger of Hy−C and Ly−C.
- T is the maximum price change for the day.
The Swing Index involves determining the largest of three values and subsequent calculations based on the identified largest value. It encapsulates the differences between consecutive day closing prices and opening prices, offering a comprehensive measure of price change.
ASI = ASI (previous) + SI (current)
ASI Interpretation:
The ASI may be used in conjunction with trading channels in order to confirm breakouts as the same trendline is to be penetrated in both situations. Generally, when the ASI is positive, it supports that the long-term trend will be higher, and when the ASI is negative, it suggests that the long-term trend will be lower.
Practical Applications:
- Trend Identification: ASI aids in identifying and confirming trends, providing a nuanced view of long-term price movements.
- Support for Breakouts: ASI is known for supporting the affirmation of breakouts, offering a comprehensive analysis of trendline penetrations.
- Use with Trading Channels: When used in conjunction with trading channels, ASI helps confirm breakouts, aligning with the trendline being penetrated.
Conclusion:
The Accumulative Swing Index stands as a valuable asset in a trader’s toolkit, offering a refined lens through which to view long-term trends. Its integration of candlestick patterns and meticulous calculations provides traders with a robust tool for making informed decisions. As markets continue to evolve, the ASI remains a stalwart companion for those navigating the complexities of financial trading.
xCalData is an exceptional app available for Android devices that offers unbiased insights into stocks, allowing investors to make informed decisions. With its user-friendly interface and comprehensive features, xCalData provides a valuable resource for anyone interested in the stock market. Download the app from google play.
For Actionable Intelligence, subscribe to xCalData app on Android devices: https://tinyurl.com/downloadxCalData
Popular Posts
-
Stock of Interest . August 23, 2024
#HSCL (NSE) Stock Report | 23 Aug 2024
-
Stock of Interest . August 23, 2024
Add Zerodha trading account to xCalData
-
Stock of Interest . August 23, 2024
What is xCalData , how to use it and how accurate is it?
-
Stock of Interest . August 23, 2024
Jurik Moving Average (JMA): A Profit Trading Insight