Technical Indicator
Posted On: January 30, 2024
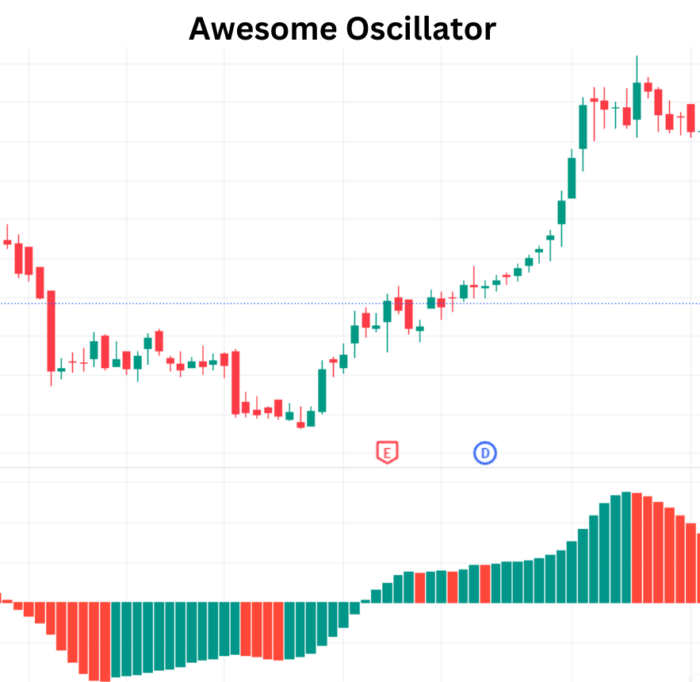
Unveiling the Awesome Oscillator: Navigating Market Momentum with Precision
In the dynamic landscape of financial markets, traders rely on a plethora of indicators to decipher trends and forecast market movements. One such powerful tool is the Awesome Oscillator (AO)technical indicator , a market momentum indicator that offers insights into the interplay between recent and historic market movements. Developed to provide a nuanced perspective on market momentum, the Awesome Oscillator employs a zero line and moving averages to guide traders in predicting trend continuations or reversals.
Mathematical Formula :
The Awesome Oscillator’s foundation lies in the calculation of the difference between two Simple Moving Averages (SMAs) based on the median price, which is the average of high and low prices. The formula for Awesome Oscillator (AO) is expressed as:
AO = SMA (median price, 5 periods) – SMA (median price, 34 periods)
Interpretation of Awesome Oscillator:
- Zero-line Crossover:
- Open Long: AO crossing above 0 signifies bullish momentum.
- Open Short: AO crossing below 0 indicates bearish momentum.
- Neutral: AO not crossing 0 implies a neutral stance.
- Saucers:
- Bullish Saucer: AO above zero with two consecutive red bars followed by a green bar implies a potential Buy signal.
- Bearish Saucer: AO below zero with two consecutive green bars followed by a red bar suggests a possible Sell signal. Else, Hold.
- Moving Average Comparison:
- Bullish: If ‘awesome ma1’ > ‘awesome ma2’.
- Neutral: If ‘awesome ma1’ = ‘awesome ma2’.
- Bearish: If ‘awesome ma1’ < ‘awesome ma2’.
- AO Value: ‘awesome ma1’ – ‘awesome ma2’.
- Twin Peaks:
- Bullish Twin Peak: Two peaks below zero, with the second higher than the first, followed by a green bar may indicate an impending breakout above zero – signaling a Buy.
- Bearish Twin Peak: Two peaks above zero, with the second lower than the first, and an immediate red bar afterward could suggest a potential Sell. Else, Hold.
Practical Applications:
- Trend Forecasting: AO assists in forecasting market momentum, helping traders anticipate trend continuations or reversals.
- Dynamic Market Conditions: The indicator adapts to changing market conditions, providing real-time insights into bullish or bearish sentiment.
- Precision Timing: Saucers and twin peaks offer specific entry or exit signals, enhancing the precision of trading decisions.
In-Depth Analysis and Strategies:
While understanding the basic interpretation is crucial, delving deeper into strategies can elevate the effectiveness of the Awesome Oscillator. Traders often combine AO with other indicators, such as Moving Average Convergence Divergence (MACD) or Relative Strength Index (RSI), for a more comprehensive analysis.
- AO with MACD:
- Convergence or divergence between AO and MACD signals potential trend reversals.
- Crosses above or below zero by both indicators confirm trend strength or weakness.
- AO for Hidden Divergence:
- Hidden divergence between price and AO can indicate trend continuation.
- Lower lows in price matched with higher lows in AO suggest strong underlying momentum.
- AO for Triple Awesome Strategy:
- Combining three AOs with different periods for a holistic view of short, mid, and long-term trends.
- Consistent alignment across periods enhances the reliability of signals.
Conclusion:
The Awesome Oscillator emerges as a versatile tool in the trader’s arsenal, offering a multi-faceted approach to understanding market momentum. Its ability to adapt to diverse market conditions and provide distinct signals makes it a valuable companion for traders navigating the complexities of financial markets. As traders seek precision in their decision-making, the Awesome Oscillator stands ready to illuminate the path forward .As traders seek precision in their decision-making, the Awesome Oscillator illuminates the path forward, offering a comprehensive approach to market momentum analysis.
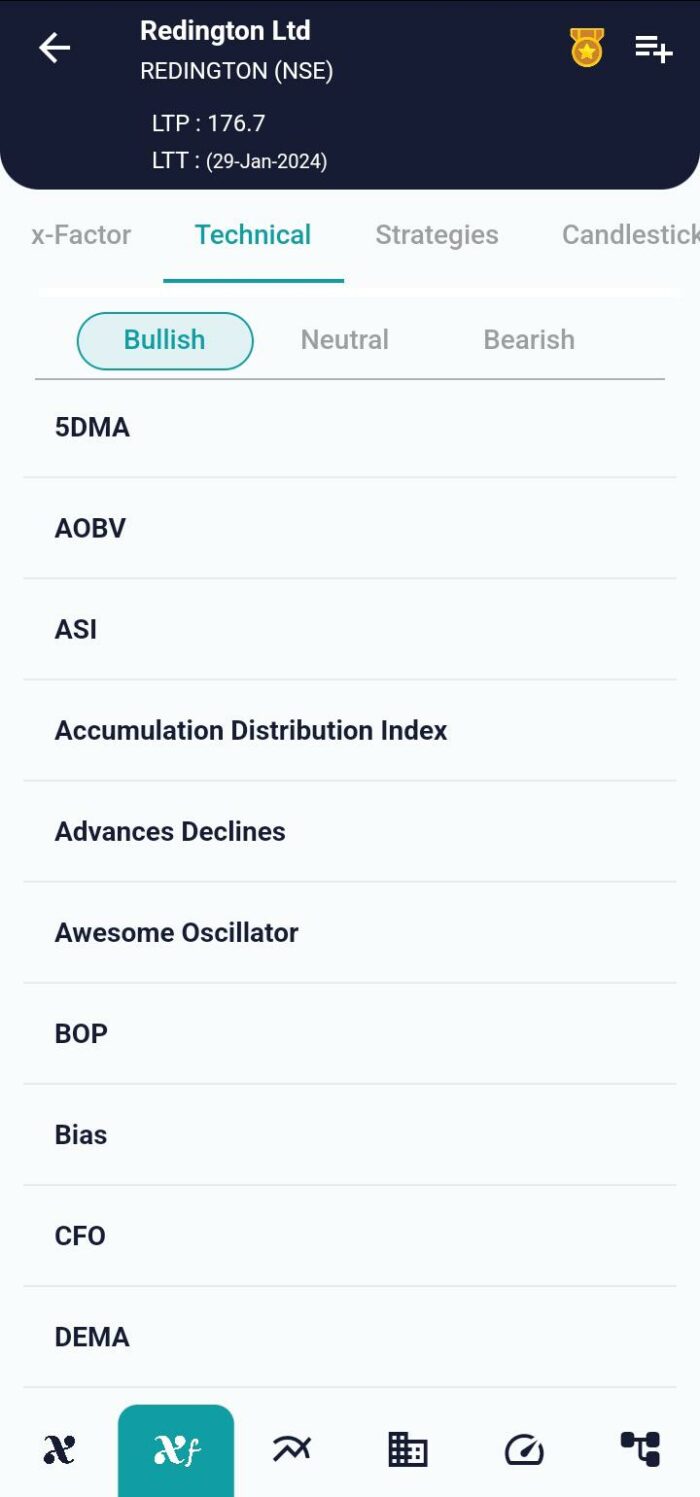
xCalData is an exceptional app available for Android devices that offers unbiased insights into stocks, allowing investors to make informed decisions. With its user-friendly interface and comprehensive features, xCalData provides a valuable resource for anyone interested in the stock market. Download the app from google play.
For Actionable Intelligence, subscribe to xCalData app on Android devices: https://tinyurl.com/downloadxCalData
Popular Posts
-
Stock of Interest . August 23, 2024
#HSCL (NSE) Stock Report | 23 Aug 2024
-
Stock of Interest . August 23, 2024
Add Zerodha trading account to xCalData
-
Stock of Interest . August 23, 2024
What is xCalData , how to use it and how accurate is it?
-
Stock of Interest . August 23, 2024
Jurik Moving Average (JMA): A Profit Trading Insight