Candlestick Pattern
Posted On: September 8, 2023
Unveiling the Bearish Counter Attack Candlestick Pattern in Trading
A Comprehensive Manual for Traders:
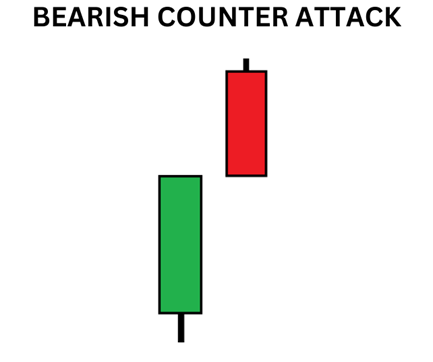
In the realm of technical analysis, candlestick patterns hold a pivotal role as they enable traders to spot potential trend reversals and gauge market sentiments. One such significant pattern is the Bearish Counter Attack, highly sought after by traders seeking bearish signals. This blog post delves into the intricacies of the Bearish Counter Attack pattern, providing insights into its characteristics, identification, interpretation, and its impact on trading strategies. The Bearish Counter Attack, a two-candlestick pattern, serves as an indicator of a possible bearish reversal in the market. Occurring after an uptrend, it signals a weakening of the bulls’ control. This pattern comprises a bullish candlestick followed by a larger bearish candlestick that engulfs the previous bullish one.
Identifying the Bearish Counter Attack Pattern:
To recognize the Bearish Counter Attack pattern, traders should focus on the following key features:
- Uptrend Context: The pattern emerges within an ongoing uptrend, hinting at a potential trend reversal.
- Initial Bullish Candlestick: The first candlestick displays a bullish stance, indicating the initial dominance of the bulls.
- Engulfing Bearish Candlestick: The second candlestick is bearish and significantly larger than its preceding bullish counterpart. It engulfs the entire body of the previous candle, representing a swift shift in sentiment from bullish to bearish.
Interpreting the Hanging Man Pattern:
The Bearish Counter Attack pattern suggests a waning of the bulls’ influence and the increasing strength of the bears. It serves as an early warning for traders to consider initiating potential short positions or adjusting stop-loss levels on existing long positions.
Confirmation and Trading Strategies:
While the Bearish Counter Attack pattern provides a compelling bearish signal, prudent traders often seek additional confirmation before acting. Strengthening the pattern’s validity can be achieved through:
- Volume Confirmation: Higher trading volume accompanying the pattern’s formation bolsters the validity of the potential trend reversal.
- Support and Resistance Levels: Identifying key support and resistance levels can further validate the pattern and aid in establishing appropriate price targets.
- Technical Indicators: Combining the Hanging Man pattern with other technical indicators, such as moving averages or RSI, can provide supplementary confirmation and enhance trading decisions.
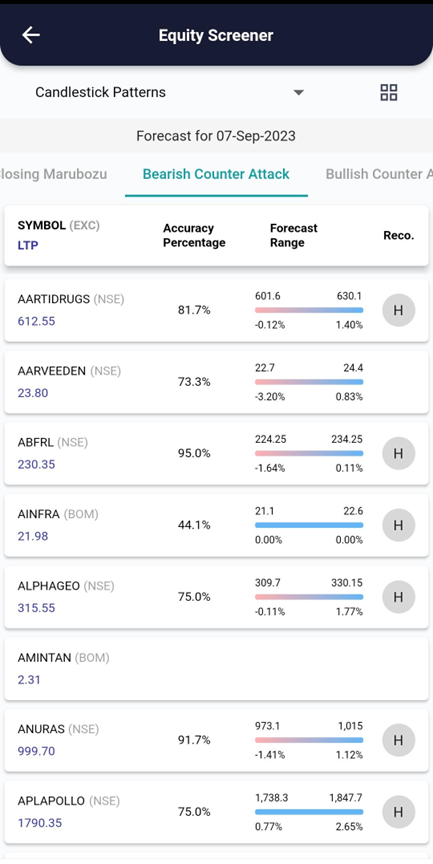
xCalData analyses the candles of individual stocks daily and identifies the stocks forming various patterns. Checkout xCalData app to know all the candle stick patterns formed by the stock of your interest.
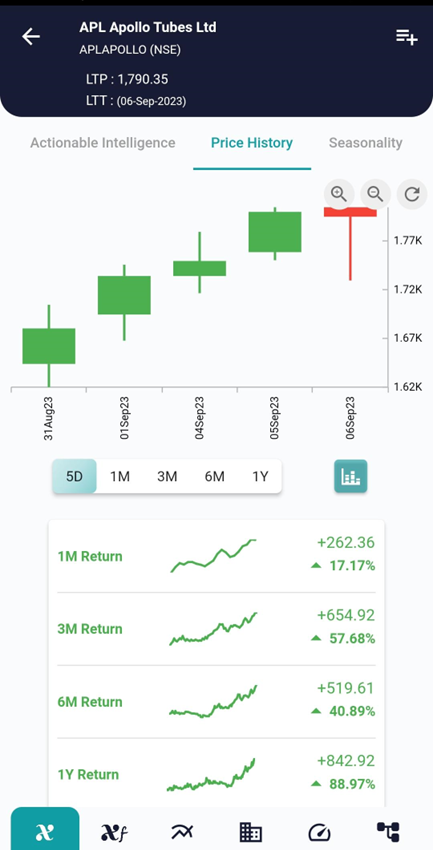
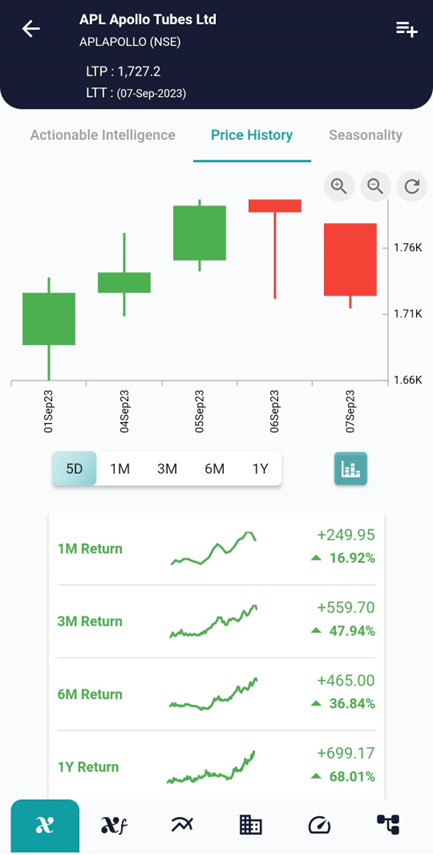
Example, on 06 Sep the stock showed the Bearish Counter Attack Pattern and on 07 Sep the stock started going down as can be seen in the interpretation above.
Conclusion:
The Bearish Counter Attack pattern is a valuable tool for traders seeking bearish signals and anticipating potential trend reversals. By grasping its characteristics and effectively identifying this pattern, traders can refine their trading strategies.
However, it is crucial to remember that no pattern guarantees success, and additional confirmation and thorough analysis are necessary for making well-informed trading decisions.
Trading always involves risk, and it is crucial to develop a well-rounded trading strategy, including risk management techniques, to increase your productivity and achieve long-term success in the financial markets, Visit and download xCalData.
Where can I see further insights on this stock?
xCalData offers unbiased insights into stocks. Download the app from google play. For Actionable Intelligence, subscribe to xCalData app on Android devices: Download here

Disclaimer: The securities quoted are for illustration only and are not recommendatory.
Popular Posts
-
Stock of Interest . August 23, 2024
#HSCL (NSE) Stock Report | 23 Aug 2024
-
Stock of Interest . August 23, 2024
Add Zerodha trading account to xCalData
-
Stock of Interest . August 23, 2024
What is xCalData , how to use it and how accurate is it?
-
Stock of Interest . August 23, 2024
Jurik Moving Average (JMA): A Profit Trading Insight