Candlestick Pattern
Posted On: July 26, 2023
Unveiling the Bearish Harami Candlestick Pattern
A Comprehensive Guide to Spotting and Interpreting Bearish Trend Reversals in Candlestick Patterns
When it comes to technical analysis in trading, candlestick patterns play a vital role in providing insights into market dynamics and potential trend reversals. One such pattern is the Bearish Harami, which holds significance for traders seeking bearish signals. In this blog post, we will explore the concept of the Bearish Harami pattern, uncover its characteristics, and discuss how traders can identify and interpret this pattern to enhance their trading decisions.
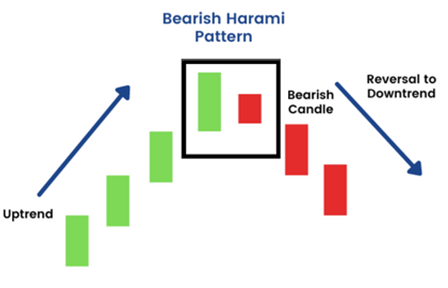
Bearish Harami is a candlestick pattern indicating a potential trend reversal from bullish to bearish. It consists of a large bullish candlestick followed by a smaller bearish candlestick that is contained within the range of the preceding bullish candlestick. The pattern suggests a weakening of bullish momentum and a potential shift in market sentiment, indicating that buyers are losing control and selling pressure may increase.
Characteristics of Bearish Harami:
To identify a Bearish Harami pattern, traders should look for the following characteristics:
- Uptrend: The pattern emerges within an existing uptrend, indicating a potential trend reversal.
- First Candle: The first candle is a large bullish candlestick, reflecting buying pressure. It could have a long or short upper shadow, but its body is typically larger.
- Second Candle: The second candle is a smaller bearish candlestick that is completely engulfed by the body of the previous bullish candle. It indicates a decrease in buying pressure and an increase in selling pressure.
- Volume: Higher trading volume during the formation of the Bearish Harami pattern adds to its significance.
Interpreting the Bearish Harami Pattern:
The Bearish Harami pattern suggests a shift in market sentiment from bullish to bearish. It signifies that selling pressure has intensified and has the potential to drive the price lower. Traders interpret this pattern as a selling opportunity or a signal to exit long positions and potentially consider short positions.
Confirmation and Trading Strategies:
While the Bearish Harami pattern provides a potential reversal signal, traders often seek additional confirmation before executing trades. Some factors to consider include:
- Resistance Levels: Look for the Bearish Harami pattern near significant resistance levels, which further strengthens the potential reversal.
- Volume Confirmation: Higher trading volume during the bearish candle confirms the strength of the pattern.
- Other Indicators: Combine the pattern with other technical indicators, such as trendlines or oscillators, to reinforce the trading decision.
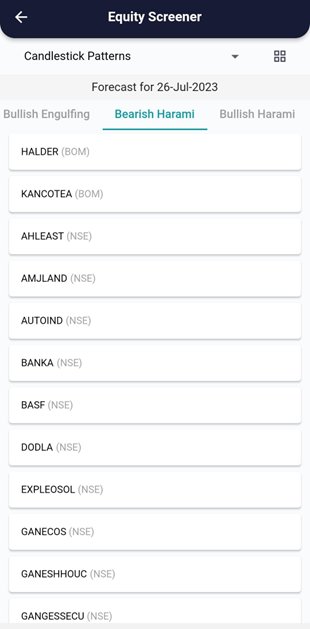
xCalData analyses the candles of individual stocks daily and identifies the stocks forming various patterns. Checkout xCalData app to know all the candle stick patterns formed by the stock of your interest.
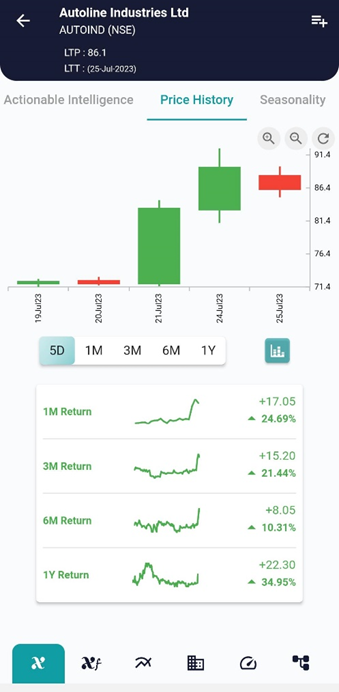
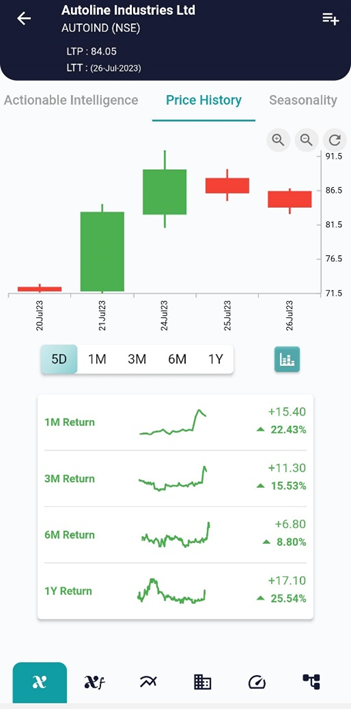
Example, on 25 July the stock showed the bearish Harami and on 26 July the stock started going down as can be seen in the charts above.
Conclusion:
The Bearish Harami pattern is a valuable candlestick pattern that signals a potential reversal from an uptrend to a downtrend. By understanding its characteristics and effectively identifying this pattern, traders can gain insights into market sentiment and enhance their trading decisions.
However, it is important to remember that no single indicator or pattern guarantees accurate predictions in the dynamic world of trading. Therefore, combining bearish Harami patterns with other technical analysis tools and risk management strategies is recommended for success in the financial markets.
Trading always involves risk, and it is crucial to develop a well-rounded trading strategy, including risk management techniques, to increase your productivity and achieve long-term success in the financial markets, Visit and download xCalData.
Where can I see further insights on this stock?
xCalData offers unbiased insights into stocks. Download the app from google play. For Actionable Intelligence, subscribe to xCalData app on Android devices: Download here

Disclaimer: The securities quoted are for illustration only and are not recommendatory.
Popular Posts
-
Stock of Interest . August 23, 2024
#HSCL (NSE) Stock Report | 23 Aug 2024
-
Stock of Interest . August 23, 2024
Add Zerodha trading account to xCalData
-
Stock of Interest . August 23, 2024
What is xCalData , how to use it and how accurate is it?
-
Stock of Interest . August 23, 2024
Jurik Moving Average (JMA): A Profit Trading Insight