Candlestick Pattern
Posted On: July 24, 2023
Unveiling the Bullish Engulfing Pattern
A Powerful Signal for Spotting Bullish Trend Reversals in Technical Analysis”
In the world of technical analysis, traders and investors often rely on candlestick patterns to gain insights into market sentiment and potential trend reversals. One such pattern is the Bullish Engulfing pattern, which holds significance for traders looking for bullish signals. In this blog post, we will delve into the concept of Bullish Engulfing, explore its characteristics, and discuss how traders can identify and interpret this pattern to make informed trading decisions.
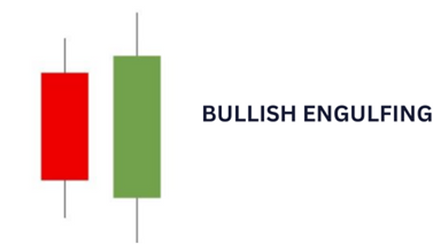
The Bullish Engulfing pattern is a two-candlestick formation that typically manifests during a downtrend. It implies that the bears’ control might be weakening, potentially leading to a bullish reversal. The pattern consists of a bearish candlestick followed by a larger bullish candlestick that “engulfs” the previous day’s bearish candlestick, overshadowing it completely.
Characteristics of Bullish Engulfing:
To identify a Bullish Engulfing pattern, traders should look for the following characteristics:
- Downtrend: The pattern occurs after a sustained downtrend in the price.
- First Candle: The first candle is bearish, indicating selling pressure. It could be a small or long-bodied candle.
- Second Candle: The second candle is bullish and has a larger body than the first candle. It completely engulfs the body of the previous bearish candle, including the shadows or wicks.
- Volume: Higher trading volume during the formation of the Bullish Engulfing pattern strengthens its significance.
Interpreting Bullish Engulfing:
The Bullish Engulfing pattern suggests a shift in market sentiment from bearish to bullish. It indicates that buying pressure has intensified and has the potential to drive the price higher. Traders interpret this pattern as a buying opportunity or a signal to exit short positions and consider initiating long positions.
Confirmation and Trading Strategies:
Confirmation and Trade Execution: While the Bullish Engulfing pattern provides a potential reversal signal, traders often seek additional confirmation before executing trades. They may consider factors such as:
- Support Levels: Look for the Bullish Engulfing pattern near significant support levels, which adds to the confirmation of a potential reversal.
- Volume Confirmation: Higher trading volume during the bullish candle confirms the strength of the pattern.
- Other Indicators: Combine the pattern with other technical indicators, such as moving averages or oscillators, to strengthen the trading decision.
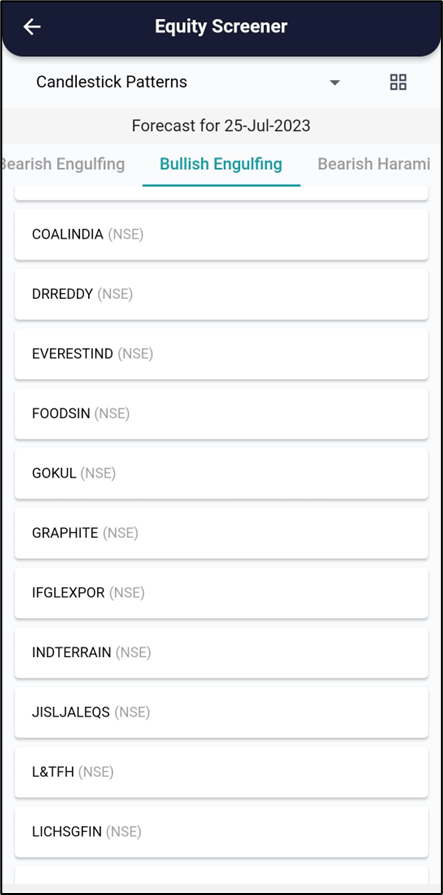
xCalData analyses the candles of individual stocks daily and identifies the stocks forming various patterns. Checkout xCalData app to know all the candle stick patterns formed by the stock of your interest.
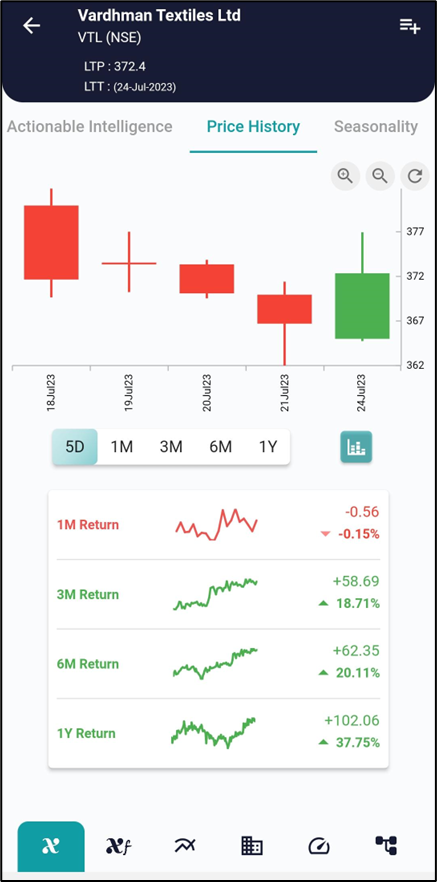
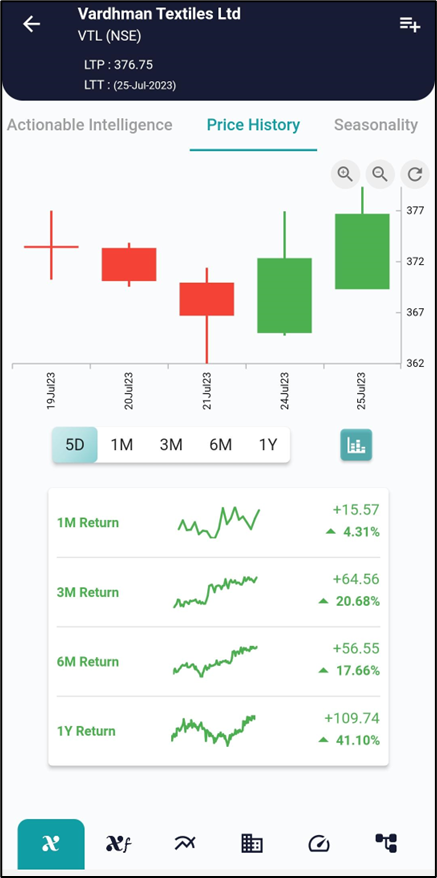
Example, on 24 July the stock showed the bullish engulf pattern and on 25 the stock started going up as can be seen in the charts above.
Conclusion:
The Bullish Engulfing pattern is a powerful candlestick pattern that signals a potential reversal from a downtrend to an uptrend. By understanding its characteristics and effectively identifying this pattern, traders can gain insights into market sentiment and make more informed trading decisions.
However, it is important to remember that no single indicator or pattern guarantees accurate predictions in the dynamic world of trading. Therefore, combining bullish engulfing patterns with other technical analysis tools and risk management strategies is recommended for success in the financial markets.
Trading always involves risk, and it is crucial to develop a well-rounded trading strategy, including risk management techniques, to increase your productivity and achieve long-term success in the financial markets, Visit and download xCalData.
Where can I see further insights on this stock?
xCalData offers unbiased insights into stocks. Download the app from google play. For Actionable Intelligence, subscribe to xCalData app on Android devices: Download here

Disclaimer: The securities quoted are for illustration only and are not recommendatory.
Popular Posts
-
Stock of Interest . August 23, 2024
#HSCL (NSE) Stock Report | 23 Aug 2024
-
Stock of Interest . August 23, 2024
Add Zerodha trading account to xCalData
-
Stock of Interest . August 23, 2024
What is xCalData , how to use it and how accurate is it?
-
Stock of Interest . August 23, 2024
Jurik Moving Average (JMA): A Profit Trading Insight