Technical Indicator
Posted On: February 6, 2024
Unveiling the KDJ Indicator: A Stochastic Upgrade for Smart Trading
Introduction to KDJ Indicator
The KDJ Indicator, an enhanced version of the Stochastic Oscillator, is a powerful technical indicator in technical analysis. Developed to pinpoint overbought and oversold levels, the KDJ stands out with its unique J line, providing traders with valuable insights into market momentum.
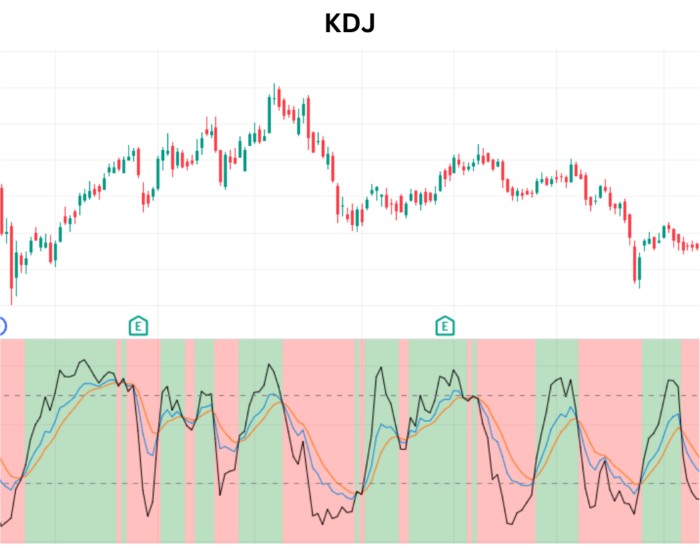
Components of KDJ
- %K Line:
- Reflects the current closing price relative to the price range over a specified period.
- %D Line:
- Represents the simple moving average of %K and smoothens out its fluctuations.
- J Line:
- Distinguishes KDJ from the traditional Stochastic Oscillator, calculated as 3×%K−2×%D.
Mathematical formula:
Fast_k = 100*(close – Lowest Low (window) / (Highest High (window)-Lowest Low (window)).
KDJ_K=EMA (Fast_K, Periods=SIGNAL)
KDJ_D=EMA (KDJ_K, Periods=SIGNAL)
KDJ_J= 3 * KDJ_K – 2 * KDJ_D
Where,
EMA= Exponential Moving Average
WINDOW=9, SIGNAL=3
Interpreting KDJ Readings
- Oversold Conditions: %K and %D below 20, indicating potential buying opportunities.
- Overbought Conditions: %K and %D above 80, signaling potential selling opportunities.
- Convergence and Divergence: Watch for crossovers and divergences between %K, %D, and J line.
Effectively Using KDJ for Trading
1. Overbought/Oversold Identification:
- Leverage KDJ to identify extreme market conditions and anticipate potential reversals.
2. Trend Confirmation:
- Confirm prevailing trends by assessing the relationship between price movements and KDJ readings.
3. Divergence Analysis:
- Identify divergence between price action and KDJ to anticipate trend reversals.
4. J Line Insights:
- Monitor the J line for additional signals, especially when it crosses key thresholds.
Cautionary Notes
- Complementary Analysis: Avoid relying solely on KDJ for trading decisions. Combine it with other indicators and analyses for a comprehensive approach.
- Appropriate Timeframes: While KDJ can be applied on various timeframes, it is often more effective on longer timeframes to filter out market noise.
Conclusion
The KDJ Indicator is a versatile tool that provides traders with a deeper understanding of market momentum and potential reversal points. By mastering its interpretation and integrating it into a well-rounded trading strategy, you can enhance your decision-making process and navigate markets more confidently. Keep exploring and adapting your approach to unlock the full potential of the KDJ Indicator in your trading journey. Happy trading!
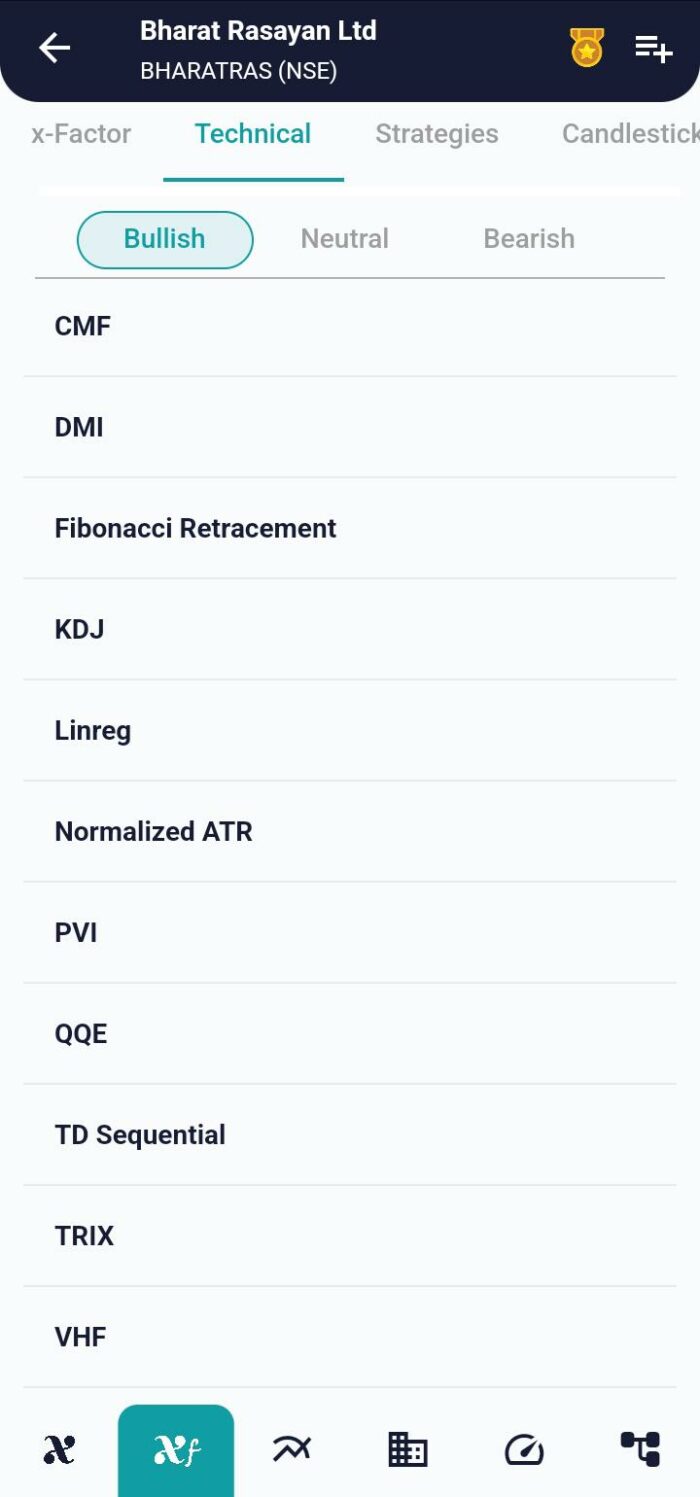
xCalData is an exceptional app available for Android devices that offers unbiased insights into stocks, allowing investors to make informed decisions. With its user-friendly interface and comprehensive features, xCalData provides a valuable resource for anyone interested in the stock market. Download the app from google play.
For Actionable Intelligence, subscribe to xCalData app on Android devices: https://tinyurl.com/downloadxCalData
Popular Posts
-
Stock of Interest . August 23, 2024
#HSCL (NSE) Stock Report | 23 Aug 2024
-
Stock of Interest . August 23, 2024
Add Zerodha trading account to xCalData
-
Stock of Interest . August 23, 2024
What is xCalData , how to use it and how accurate is it?
-
Stock of Interest . August 23, 2024
Jurik Moving Average (JMA): A Profit Trading Insight