Technical Indicator
Posted On: February 2, 2024
Unveiling the Magic of Fibonacci in Trading
Introduction to Fibonacci: The Golden Ratio Unleashed
In the vast landscape of financial markets, traders often seek tools and techniques to decode the mysteries of price movements. One such mystical yet powerful technical indicator is the Fibonacci sequence, a mathematical wonder that finds profound applications in technical analysis. Let’s embark on a journey to unravel the magic of Fibonacci in trading.
Understanding the Fibonacci Sequence:
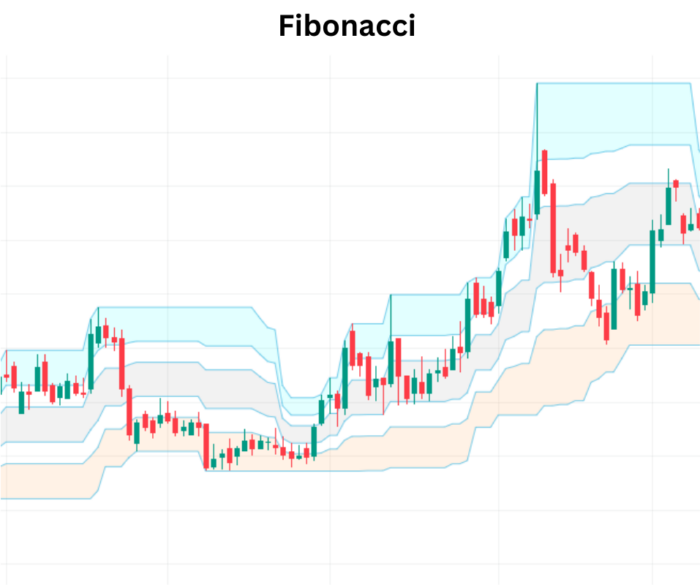
The Fibonacci sequence is a series of numbers where each number is the sum of the two preceding ones: 0, 1, 1, 2, 3, 5, 8, 13, 21, and so on. This sequence gives rise to the this indicator ratios, such as 0.618 (Golden Ratio) and 0.382, which have intriguing connections to natural phenomena and, interestingly, financial markets.
Fibonacci Retracement: Illuminating Potential Reversal Levels
Definition:
this indicator retracement is a technical analysis tool that helps identify potential levels of support and resistance by plotting horizontal lines at key this indicator levels.
Application:
- Selecting Key Points: Identify a significant price move by selecting a recent swing high and low.
- Plotting Fibonacci Levels: Plot retracement levels at 23.6%, 38.2%, 50%, 61.8%, and 78.6%.
Interpretation:
- Support and Resistance: this indicator retracement levels act as potential support (in an uptrend) or resistance (in a downtrend).
- Psychological Levels: Traders often watch these levels as they are widely followed in the market.
Strategy:
- Buying Opportunities: Traders may look for buying opportunities near this indicator support levels during an uptrend.
- Selling Opportunities: In a downtrend, potential selling opportunities arise near this indicator resistance levels.
Fibonacci Extension: Forecasting Future Price Levels
Definition:
this indicator extension is a tool used to identify potential levels of future support or resistance by projecting key this indicator levels beyond the current price range.
Application:
- Selecting Anchor Points: Identify three significant points – a trend start, a significant peak or trough, and a pullback point.
- Plotting Extension Levels: Plot extension levels at 127.2%, 161.8%, 261.8%, and 423.6%.
Interpretation:
- Price Projection: this indicator extension levels indicate potential price targets for the next phase of the trend.
Strategy:
- Exit Points: Traders may use this indicator extension levels to set profit targets or identify potential reversal points.
- Trend Continuation: Extensions can be used to gauge the strength of an existing trend and anticipate its continuation.
The Psychological Edge of Fibonacci:
The effectiveness of this indicator retracement and extension lies in the psychology of market participants. As traders widely use these levels, they become self-fulfilling prophecies, influencing decision-making and reinforcing the significance of these key levels.
Case Study: Navigating Market Moves with Fibonacci:
Consider a scenario where a stock experiences a significant pullback, and a trader applies this indicator retracement to identify potential support levels. The price finds support near the 61.8% level, confirming the potency of Fibonacci strategies.
Conclusion: Harnessing the Power of Fibonacci Mastery
In the realm of trading, where precision and foresight are paramount, this indicator retracement and extension emerge as potent allies for traders. Whether deciphering potential reversal levels, projecting future price targets, or navigating complex market dynamics, this indicator strategies offer a roadmap for mastery. As you embark on your trading journey, let the magic of this indicator be your guide, unlocking the secrets woven into the fabric of financial markets. Embrace the golden spiral, and let Fibonacci illuminate your path to trading excellence.
xCalData is an exceptional app available for Android devices that offers unbiased insights into stocks, allowing investors to make informed decisions. With its user-friendly interface and comprehensive features, xCalData provides a valuable resource for anyone interested in the stock market. Download the app from google play.
For Actionable Intelligence, subscribe to xCalData app on Android devices: https://tinyurl.com/downloadxCalData
Popular Posts
-
Stock of Interest . August 23, 2024
#HSCL (NSE) Stock Report | 23 Aug 2024
-
Stock of Interest . August 23, 2024
Add Zerodha trading account to xCalData
-
Stock of Interest . August 23, 2024
What is xCalData , how to use it and how accurate is it?
-
Stock of Interest . August 23, 2024
Jurik Moving Average (JMA): A Profit Trading Insight