Technical Indicator
Posted On: February 2, 2024
Using the Power of Fisher Transform : Transforming Trading
Introduction to the Fisher Transform: A Gaussian Perspective
In the vast realm of financial markets, traders are always on the lookout for tools that can provide unique insights and enhance decision-making. Enter the Fisher Transform, a technical analysis technical indicator designed by J.F. Ehlers to transform probability distributions and identify potential turning points. Let’s delve into the intricacies of the Fisher Transform and explore how it can elevate your trading strategies.
Understanding the Fisher Transform: Unleashing Gaussian Magic
The Fisher Transform is ingeniously crafted to convert the probability distribution of input data into a Gaussian distribution. This transformation is achieved through mathematical calculations applied to the input data, commonly the price of a financial instrument. The resulting transformed values oscillate between predetermined boundaries and are centered around zero, offering a more normalized distribution.
How Does the Fisher Transform Work?
The Fisher Transform takes the following steps to bring about its Gaussian magic:
- Input Data: The primary input is typically the price of a financial asset.
- Mathematical Transformation: Through a series of mathematical calculations, the Fisher Transform processes the input data.
- Normalized Distribution: The transformed values are centered around zero, creating a more Gaussian or normal distribution.
- Oscillation: The resulting values oscillate within predefined boundaries, providing a clearer view of potential reversals.
Trading Signals with the Fisher Transform: Bullish and Bearish Perspectives
Bullish Signals: Riding the Wave of Optimism
- Crossover Above Signal Line: A bullish signal is generated when the Fisher Transform crosses above the signal line. The signal line is typically a one-step shift of the Fisher value.
- Potential Reversal: This crossover indicates a potential bullish reversal, suggesting an opportune moment to consider buying the asset.
Bearish Signals: Navigating the Waters of Caution
- Crossover Below Signal Line: A bearish signal emerges when the Fisher Transform crosses below the signal line.
- Bearish Reversal: This crossover signifies a potential bearish reversal, providing a signal to contemplate selling the asset.
Harnessing the Fisher Transform in Real Market Scenarios
Consider a scenario where the Fisher Transform crosses above the signal line for a particular stock. This bullish signal aligns with a subsequent uptrend in the stock’s price, affirming the efficacy of the Fisher Transform in capturing potential trend reversals.
Conclusion: Elevating Your Trading Journey with the Fisher Transform
As you navigate the dynamic landscape of financial markets, the Fisher Transform stands out as a tool that not only transforms data distributions but also transforms your approach to trading. By identifying potential turning points with clear signals, the Fisher Transform empowers traders to make informed decisions. Embrace the Gaussian magic, ride the waves of bullish optimism, and navigate the waters of caution with the Fisher Transform as your guiding light on the path to trading mastery.
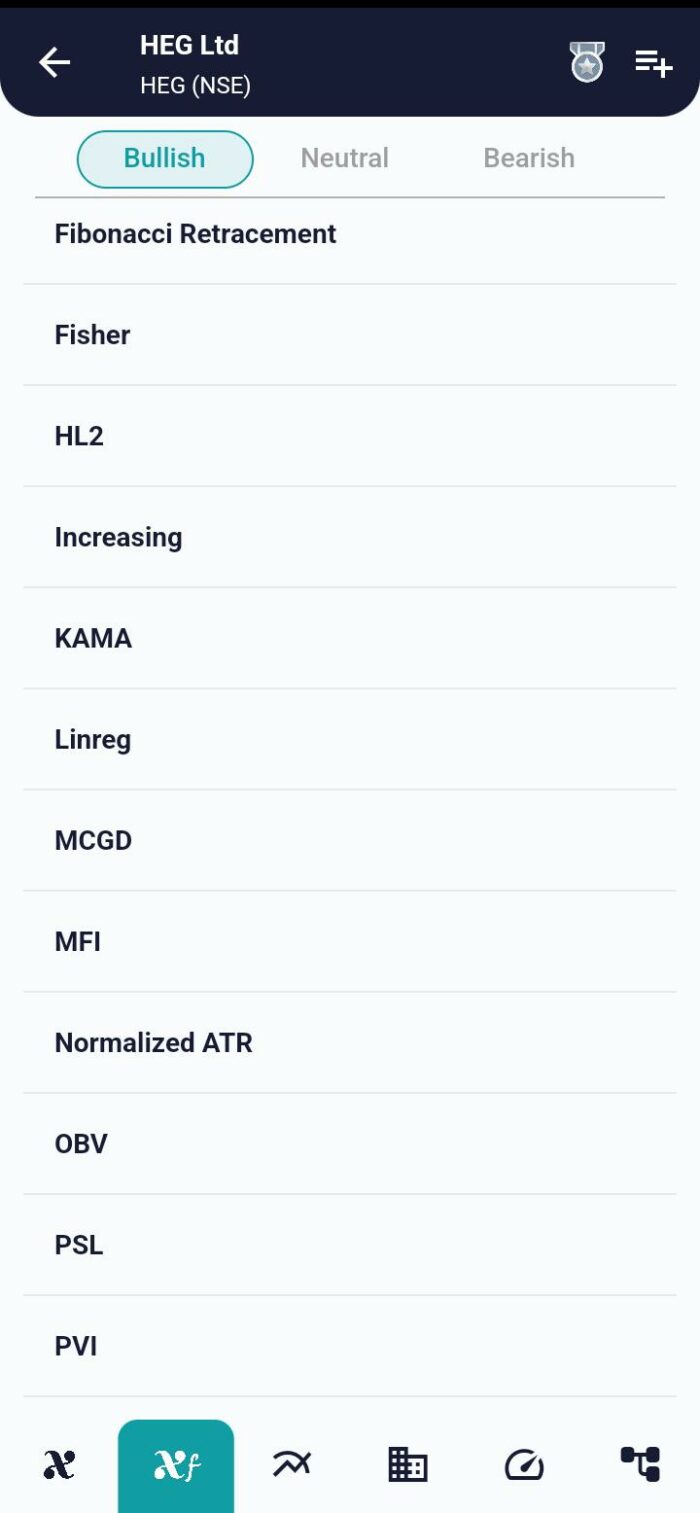
xCalData is an exceptional app available for Android devices that offers unbiased insights into stocks, allowing investors to make informed decisions. With its user-friendly interface and comprehensive features, xCalData provides a valuable resource for anyone interested in the stock market. Download the app from google play.
For Actionable Intelligence, subscribe to xCalData app on Android devices: https://tinyurl.com/downloadxCalData
Popular Posts
-
Stock of Interest . August 23, 2024
#HSCL (NSE) Stock Report | 23 Aug 2024
-
Stock of Interest . August 23, 2024
Add Zerodha trading account to xCalData
-
Stock of Interest . August 23, 2024
What is xCalData , how to use it and how accurate is it?
-
Stock of Interest . August 23, 2024
Jurik Moving Average (JMA): A Profit Trading Insight