Technical Indicator
Posted On: February 6, 2024
Volume Insights: Destroy Trends with Klinger Volume Oscillator (KVO)
Unveiling the Insights of the Klinger Volume Oscillator
Developed by Stephen Klinger, the Klinger Volume Oscillator (KVO) is a potent technical indicator designed to determine the long-term trend of money flow while remaining responsive to short-term fluctuations. By comparing volume and price movements, the KVO transforms the data into an oscillator, offering traders valuable insights into potential trend reversals.
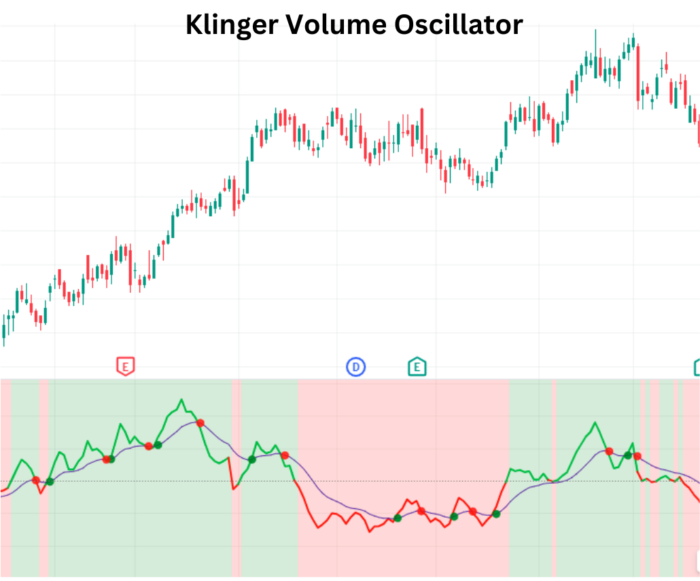
Anatomy of the Klinger Volume Oscillator
The Klinger Volume Oscillator KVO operates by calculating the difference between two moving averages, with a unique twist – these averages are based on more than just price. This approach allows the oscillator to remain sensitive to both price movements and volume dynamics, making it a versatile indicator for traders.
Mathematical formula:
KeyPricet=(Hight+Lowt+Closet)/3
KeyPricet−1=(Hight−1+Lowt−1+Closet−1)/3
Trend=(ifKeyPricet>KeyPricet−1= Volume, ifKeyPricet<KeyPricet−1=−Volume)
KVO=EMAshort−period(Trend)−EMAlong−period(Trend)
KVO Signal=EMA signal(KVO)
Interpreting the KVO Signals
1. Buy Signals:
- When the current day’s Klinger Volume Oscillator value is greater than 0 and the previous value is less than or equal to zero, a Buy signal is generated. This suggests a favorable condition for potential upward price movement.
2. Sell Signals:
- Conversely, when the current day’s Klinger Volume Oscillator value is less than 0 and the previous value is greater than or equal to zero, a Sell signal is triggered. This indicates a potential downturn in prices.
3. Signal Line Confirmation:
- Introducing a Signal line enhances the Klinger Volume Oscillator signaling capabilities. If the current day’s KVO value is greater than the Signal line and the previous value is less than or equal to zero, it generates a Buy signal. Conversely, if the KVO value is less than the Signal line and the previous value is greater than or equal to zero, a Sell signal is initiated.
Strategies for Effective Utilization
1. Divergence Analysis:
- Watch for divergences between price movements and the KVO, as they can signify potential trend reversals.
2. Confirmation with Other Indicators:
- Strengthen the reliability of KVO signals by corroborating them with insights from other technical indicators.
3. Volume Analysis:
- Pay attention to volume dynamics in conjunction with KVO signals for a comprehensive understanding of market sentiment.
Cautionary Considerations
- Signal Confirmation: Consider using KVO signals in conjunction with other technical indicators to confirm potential trend changes.
- Market Context: Always evaluate KVO signals within the broader context of market conditions to avoid isolated interpretations.
In Conclusion
The Klinger Volume Oscillator empowers traders with a unique perspective on market trends. By harnessing its insights into money flow dynamics, traders can make informed decisions and navigate the ever-changing financial landscape. As you integrate the KVO into your trading toolkit, may your endeavors be marked by success and prosperity. Happy trading!
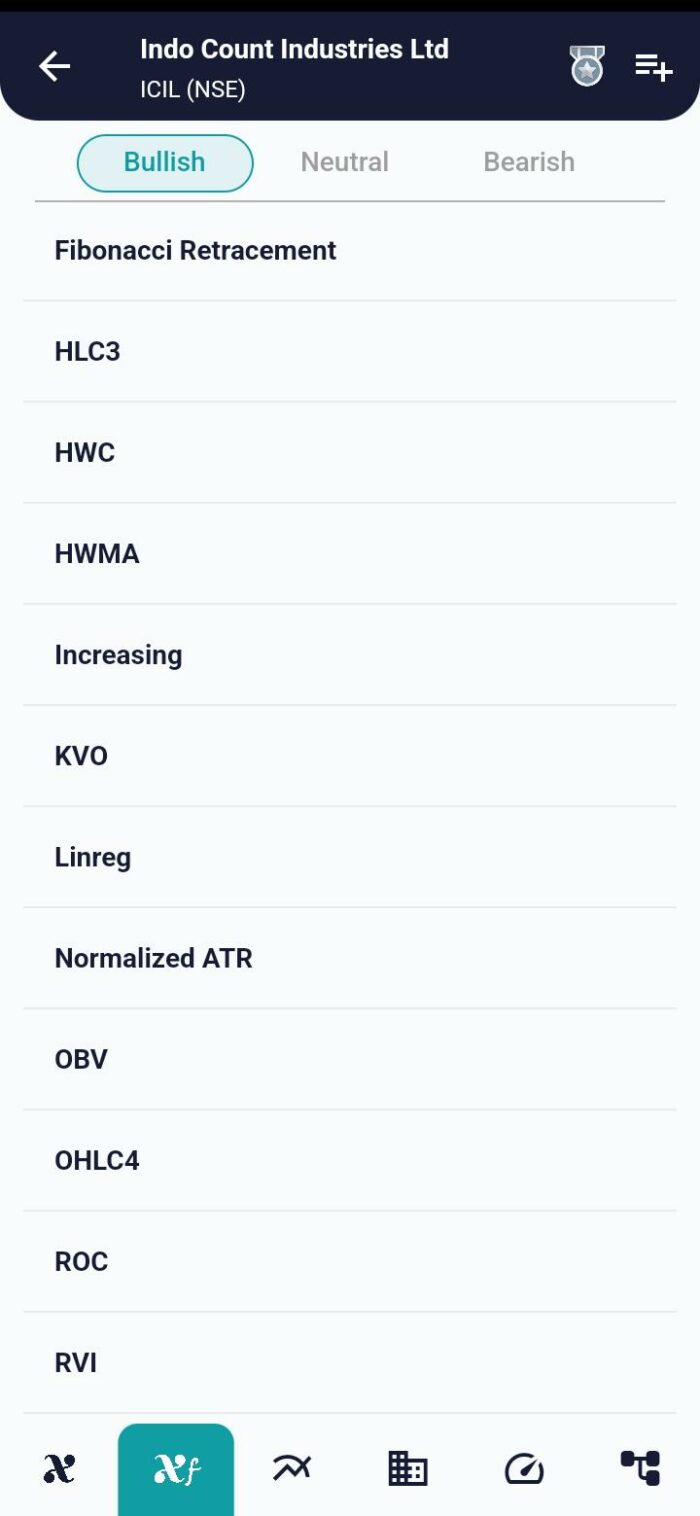
xCalData is an exceptional app available for Android devices that offers unbiased insights into stocks, allowing investors to make informed decisions. With its user-friendly interface and comprehensive features, xCalData provides a valuable resource for anyone interested in the stock market. Download the app from google play.
For Actionable Intelligence, subscribe to xCalData app on Android devices: https://tinyurl.com/downloadxCalData
Popular Posts
-
Stock of Interest . August 23, 2024
#HSCL (NSE) Stock Report | 23 Aug 2024
-
Stock of Interest . August 23, 2024
Add Zerodha trading account to xCalData
-
Stock of Interest . August 23, 2024
What is xCalData , how to use it and how accurate is it?
-
Stock of Interest . August 23, 2024
Jurik Moving Average (JMA): A Profit Trading Insight