
The 180‑Day Moving Average (180DMA) crossover is a widely respected technical indicator used to evaluate long‑term market direction. By averaging closing prices over roughly nine months of trading activity, it provides a stable measure of momentum and helps investors distinguish genuine trend shifts from short‑term noise.
Structure of the Indicator
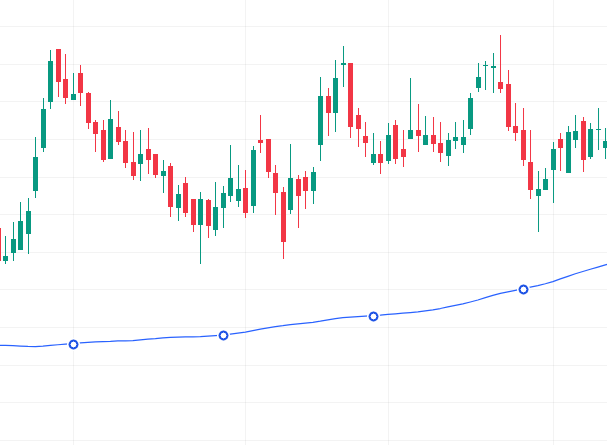
The 180DMA is calculated by summing the closing prices of the last 180 trading sessions and dividing by 180.
- Bullish crossover: Price moves above the 180DMA, suggesting renewed long‑term buying strength.
- Bearish crossover: Price falls below the 180DMA, signaling weakening sentiment and possible trend reversal.
Distinctive Attributes
- Extended Trend Analysis: Focuses on broad market direction rather than short‑term fluctuations.
- Noise Filtering: Smooths out temporary volatility, offering clearer signals.
- Institutional Relevance: Frequently monitored by portfolio managers and long‑term investors.
- Dynamic Role: Acts as a support or resistance level in extended trends.
- Reliable Signals: Generates fewer false alerts compared to shorter averages.
- Portfolio Utility: Useful for aligning investment strategies with prevailing market conditions.
Market Psychology Reflected
- Above 180DMA: Indicates confidence among buyers, reinforcing bullish sentiment.
- Below 180DMA: Suggests sellers are in control, warning of potential weakness.
- Stability Factor: Because of its length, the 180DMA reflects collective market psychology over months, not days.
Analytical Considerations
- The 180DMA is less sensitive than short‑term averages, making it ideal for identifying major shifts rather than intraday moves.
- Investors often combine it with momentum indicators (RSI, MACD), sector rotation analysis, or volume studies to strengthen reliability.
- It is particularly effective in trend‑driven markets, where long‑term sentiment outweighs short‑term volatility.
Contextual Importance
- For Position Traders: Helps maintain alignment with the dominant market direction.
- For Portfolio Managers: Serves as a benchmark for asset allocation and risk management.
- During Volatile Phases: Provides stability by filtering out temporary swings.
Final Insight
The 180DMA crossover is a cornerstone of long‑term technical analysis. Its ability to filter noise and highlight major directional shifts makes it invaluable for investors seeking stability and clarity. While slower to react than short‑term averages, its reliability and institutional relevance ensure it remains a trusted guide for portfolio management and strategic decision‑making. Recognizing its signals allows traders and investors to stay disciplined, avoid emotional reactions, and remain aligned with the broader market trend.