
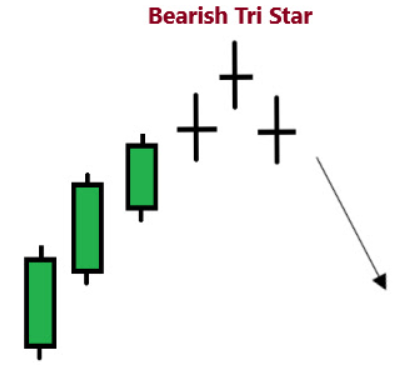
The Bearish Tri‑Star candlestick formation is one of the rarest reversal patterns in technical analysis. It consists of three consecutive doji candles that appear after a bullish rally, each separated by gaps. This unusual sequence reflects extreme indecision in the market and often precedes a bearish reversal.
Candle Sequence in Detail
- First Doji – Initial Pause: Appears after an uptrend, showing hesitation and uncertainty among buyers.
- Second Doji – Gap Up Weakness: Forms above the first candle, highlighting lack of conviction and fading momentum.
- Third Doji – Gap Down Exhaustion: Appears below the second candle, completing the tri‑star alignment and signaling that neither side is in control.
Distinctive Attributes
- Typically emerges at the top of a rally, making it a potential reversal marker.
- All three candles are dojis, where the open and close are nearly equal, reflecting indecision.
- Each doji gaps away from the previous one, creating a star‑like sequence.
- The signal gains credibility when followed by a bearish confirmation candle.
Sentiment Dynamics
- Buyer Control Weakens: The first doji shows hesitation after a period of strong bullish activity.
- Uncertainty Deepens: The second doji, despite gapping higher, fails to continue the advance, suggesting lack of conviction.
- Exhaustion Evident: The third doji gaps lower, confirming that buyers are losing strength and sellers are preparing to step in.
- Psychological Shift: Traders interpret this as a sign of exhaustion in the uptrend, anticipating a reversal.
This psychological sequence demonstrates how the Bearish Tri‑Star captures the transition from dominance to indecision, paving the way for renewed bearish sentiment.
Analytical Considerations
- The Bearish Tri‑Star is extremely rare, requiring precise doji formations and gap placements.
- Without confirmation, it may represent only consolidation rather than a true reversal.
- Best interpreted when paired with momentum indicators (RSI, MACD), moving averages, or volume analysis to validate the setup.
Contextual Importance
- At Market Tops: Acts as a warning that bullish enthusiasm may be fading.
- During Extended Rallies: Serves as a sign that buyers are losing conviction.
- Volume Confirmation: Heavy trading activity during subsequent bearish candles adds credibility to the reversal signal.
Final Insight
The Bearish Tri‑Star candlestick pattern is a rare but powerful warning of trend exhaustion. Its unique structure of three dojis with gaps makes it highly distinctive, and when confirmed by a bearish candle, it provides traders with confidence to anticipate reversals. Recognizing this formation at the top of an uptrend allows market participants to prepare for downturns and manage risk more effectively, making it a valuable addition to advanced candlestick analysis.