
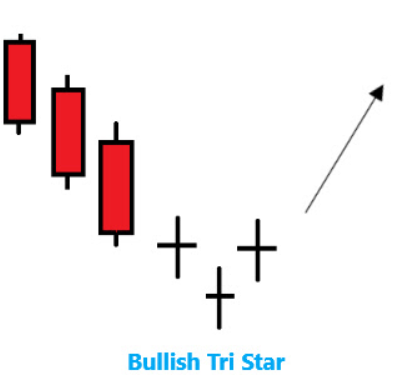
The Bullish Tri‑Star candlestick formation is one of the rarest reversal patterns in technical analysis. It consists of three consecutive doji candles that appear after a bearish decline, each separated by gaps. This unusual sequence reflects extreme indecision in the market and often precedes a bullish reversal.
Candle Sequence in Detail
- First Doji – Initial Pause: Appears after a downtrend, showing hesitation and uncertainty among sellers.
- Second Doji – Gap Down Weakness: Forms below the first candle, highlighting lack of conviction and fading momentum.
- Third Doji – Gap Up Exhaustion: Appears above the second candle, completing the tri‑star alignment and signaling that neither side is in control.
Distinctive Attributes
- Typically emerges at the bottom of a decline, making it a potential reversal marker.
- All three candles are dojis, where the open and close are nearly equal, reflecting indecision.
- Each doji gaps away from the previous one, creating a star‑like sequence.
- The signal gains credibility when followed by a bullish confirmation candle.
Sentiment Dynamics
- Seller Control Weakens: The first doji shows hesitation after a period of strong bearish activity.
- Uncertainty Deepens: The second doji, despite gapping lower, fails to continue the decline, suggesting lack of conviction.
- Exhaustion Evident: The third doji gaps higher, confirming that sellers are losing strength and buyers are preparing to step in.
- Psychological Shift: Traders interpret this as a sign of exhaustion in the downtrend, anticipating a reversal.
This psychological sequence demonstrates how the Bullish Tri‑Star captures the transition from dominance to indecision, paving the way for renewed bullish sentiment.
Analytical Considerations
- The Bullish Tri‑Star is extremely rare, requiring precise doji formations and gap placements.
- Without confirmation, it may represent only consolidation rather than a true reversal.
- Best interpreted when paired with momentum indicators (RSI, MACD), moving averages, or volume analysis to validate the setup.
Contextual Importance
- At Market Bottoms: Acts as a warning that bearish enthusiasm may be fading.
- During Extended Declines: Serves as a sign that sellers are losing conviction.
- Volume Confirmation: Heavy trading activity during subsequent bullish candles adds credibility to the reversal signal.
Final Insight
The Bullish Tri‑Star candlestick pattern is a rare but powerful warning of trend exhaustion. Its unique structure of three dojis with gaps makes it highly distinctive, and when confirmed by a bullish candle, it provides traders with confidence to anticipate reversals. Recognizing this formation at the bottom of a downtrend allows market participants to prepare for recoveries and manage risk more effectively, making it a valuable addition to advanced candlestick analysis.