
The Percentage Price Oscillator (PPO) Value Crossovers Indicator is a momentum tool derived from the PPO framework. While the PPO itself measures the percentage difference between two exponential moving averages (EMAs), the crossover version emphasizes the exact points where the PPO line intersects its signal line. These intersections highlight shifts in momentum, offering traders a structured way to identify potential reversals or continuation phases across different markets.
Structural Components
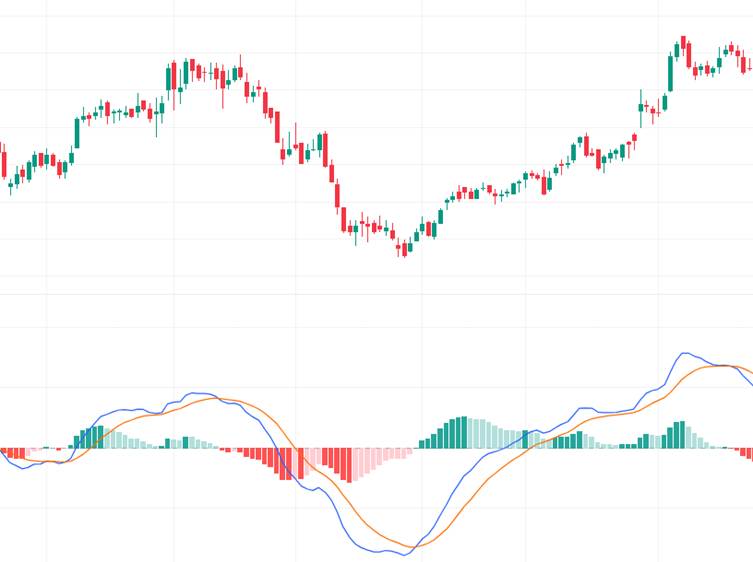
The PPO Value Crossovers Indicator is built on two key elements:
- PPO Line: Represents the percentage difference between two EMAs (commonly 12‑period and 26‑period).
- Signal Line: A smoothed EMA (often 9‑period) of the PPO line.
- Bullish Crossover: Occurs when the PPO line rises above the signal line.
- Bearish Crossover: Triggered when the PPO line falls below the signal line.
This dual‑line structure ensures traders can visualize both momentum strength and directional changes with clarity.
Distinctive Attributes
- Percentage Normalization: Expresses values as percentages, making comparisons across assets more consistent.
- Crossover Precision: Provides clear buy/sell triggers through line intersections.
- Trend Sensitivity: Expands during strong momentum phases and contracts during consolidation.
- Noise Filtering: The signal line smooths random fluctuations for cleaner interpretation.
- Multi‑Asset Utility: Effective across equities, forex, commodities, and cryptocurrencies.
Market Psychology Reflected
- Bullish Crossovers: Indicate growing optimism and stronger buying conviction.
- Bearish Crossovers: Suggest weakening sentiment and potential reversal pressure.
- Stable Readings: Reflect balanced participation and consolidation phases.
- Momentum Divergence: Highlights hesitation when price continues in one direction but PPO crossovers fail to confirm strength.
This dynamic captures crowd behavior, showing whether traders are genuinely committed to a move or reacting to short‑term noise.
Analytical Considerations
- PPO Value Crossovers are momentum‑sensitive, making them effective for identifying shifts in trend strength.
- They are often paired with RSI, MACD, or volume indicators for layered confirmation.
- Particularly useful for systematic models and discretionary traders, where precision and reduced noise are critical.
- Customizable parameters allow adaptation to different volatility levels and timeframes.
Contextual Importance
- Momentum Validation: Confirms whether price action is supported by strong conviction.
- Reversal Alerts: Detects weakening momentum before price shifts occur.
- Noise Filtering: Provides smoother signals that reduce false entries.
- Decision Support: Enhances confidence by offering clearer visualization of market direction.
Final Insight
The PPO Value Crossovers Indicator is a refined extension of the classic PPO, designed to highlight both momentum and directional changes through crossover signals. Its percentage‑based calculation makes it more adaptable than absolute‑value indicators like MACD, allowing for cross‑asset comparison. By reducing noise and emphasizing clear triggers, PPO Value Crossovers provide traders with a disciplined framework to interpret bullish and bearish conditions across multiple financial markets.