
The Parabolic Stop and Reverse (PSAR) Crossovers Indicator is a trend‑following tool designed to highlight exact points where price action shifts relative to the PSAR dots. Originally introduced by J. Welles Wilder, the PSAR itself is widely recognized for tracking momentum and identifying potential reversals. The crossover version emphasizes clarity by marking the precise buy and sell signals when price crosses above or below the PSAR dots, making it easier for traders to time decisions with discipline.
Structural Components
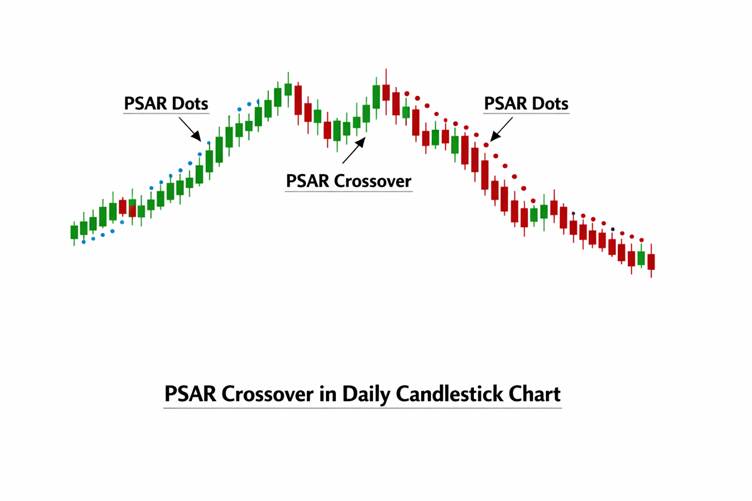
The PSAR Crossovers Indicator is built on the following framework:
- PSAR Dots: Plotted below price during uptrends and above price during downtrends.
- Bullish Crossover: Occurs when price moves above the PSAR dots.
- Bearish Crossover: Triggered when price falls below the PSAR dots.
- Trend Continuation: Dots trail closer to price as the trend matures, flipping sides when reversals occur.
This structure provides both directional context and precise crossover points for actionable signals.
Distinctive Attributes
- Clear Entry/Exit Signals: Crossovers highlight straightforward buy or sell triggers.
- Trend‑Following Nature: Works best in strongly directional markets.
- Noise Filtering: Focuses on decisive crossovers, reducing minor fluctuations.
- Dynamic Adjustment: PSAR dots shift with price, adapting to volatility.
- Versatility: Applicable across multiple timeframes and asset classes.
Market Psychology Reflected
- Bullish Crossovers: Indicate growing optimism and momentum support.
- Bearish Crossovers: Suggest weakening sentiment and potential reversal.
- Trailing Dots: Reflect crowd confidence as trends extend, but also highlight exhaustion when dots flip sides.
- Stable Signals: Provide reassurance in volatile conditions by focusing on decisive shifts.
This dynamic mirrors how traders interpret conviction in market moves, offering a structured view of sentiment transitions.
Analytical Considerations
- PSAR Crossovers are trend‑sensitive, making them effective for identifying continuation and reversal points.
- They are often paired with RSI, MACD, or moving averages for layered confirmation.
- Particularly useful for systematic models and discretionary traders, where precision and reduced noise are critical.
- Customizable parameters allow adaptation to different volatility levels and timeframes.
Contextual Importance
- Momentum Validation: Confirms whether price action supports bullish or bearish sentiment.
- Reversal Alerts: Detects weakening momentum before price shifts occur.
- Risk Management: PSAR dots can act as dynamic stop‑loss levels.
- Decision Support: Enhances confidence by offering clearer visualization of market direction.
Final Insight
The PSAR Crossovers Indicator is a powerful extension of the classic Parabolic SAR, designed to highlight both momentum and trend direction through precise crossover signals. Its ability to provide clear buy/sell triggers, dynamic stop‑loss levels, and reversal detection makes it valuable across all financial markets. When combined with momentum or volume‑based tools, PSAR Crossovers enhance accuracy and confidence, offering traders a disciplined framework to navigate bullish and bearish conditions effectively.