
The Down Gap Side‑by‑Side White Lines candlestick formation is a rare two‑candle continuation pattern that appears during a downtrend. Despite the presence of two bullish candles, the context of the downward gap makes this setup a bearish signal, showing that sellers remain in control.
Candle Sequence in Detail
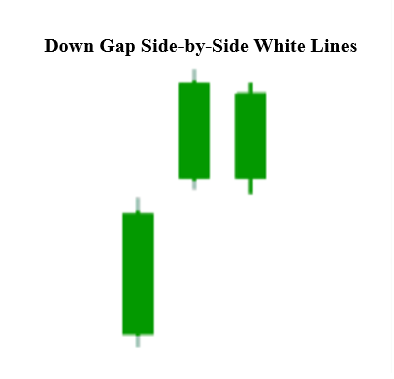
- First Candle – Bullish Attempt After Gap: A bullish candle forms after a downward gap, suggesting buyers are trying to regain ground.
- Second Candle – Parallel Bullish Close: Another bullish candle opens near the first candle’s open and closes at a similar level, creating the “side‑by‑side” appearance.
Distinctive Attributes
- Typically emerges within a declining trend, reinforcing continuation rather than reversal.
- Both candles are bullish, but their placement after a downward gap is the defining feature.
- The nearly equal closes create the visual impression of parallel white lines.
- The signal gains credibility when sellers resume control after the pattern, especially with high trading volume.
Sentiment Dynamics
- Seller Dominance: The downward gap reflects strong bearish momentum.
- Buyer Hesitation: Two bullish candles appear, but they fail to push prices higher, showing lack of conviction.
- Renewed Bearish Pressure: The inability of buyers to break resistance signals weakness, encouraging sellers to continue the decline.
This psychological sequence demonstrates how the Down Gap Side‑by‑Side White Lines captures failed optimism, turning it into confirmation of bearish strength.
Analytical Considerations
- The Down Gap Side‑by‑Side White Lines is rare, requiring precise gap and alignment.
- Without confirmation, it may represent only short‑term consolidation rather than a true continuation.
- Best interpreted when paired with momentum indicators (RSI, MACD), moving averages, or volume analysis to validate the setup.
Contextual Importance
- During Strong Downtrends: Acts as reinforcement of bearish conviction, suggesting further declines.
- Near Support Levels: Serves as a sign that temporary bullish moves are failing to disrupt the broader trend.
- Volume Confirmation: Heavy trading activity during subsequent bearish candles adds credibility to the continuation signal.
Final Insight
The Down Gap Side‑by‑Side White Lines candlestick pattern is a deceptive setup: although both candles are bullish, the broader context of the downward gap makes it a bearish continuation signal. Its rarity and precision make it noteworthy, and when confirmed by volume or supporting indicators, it provides traders with confidence to stay aligned with bearish momentum. Recognizing this formation helps market participants avoid false optimism and anticipate sustained downward movement.