
Introduction
The Heikin Ashi Indicator, developed in Japan, modifies traditional candlestick charts to filter out market noise. The term Heikin Ashi translates to “average bar,” and the technique uses averaged values of open, close, high, and low prices to create smoother candlesticks. Traders rely on Heikin Ashi to visualize trends more clearly, reduce false signals, and identify potential reversals with greater precision.
Structural Framework
Heikin Ashi candlesticks are calculated differently from standard candlesticks:
- Close Price → ((Open + High + Low + Close) ÷ 4)
- Open Price → ((Previous Heikin Ashi Open + Previous Heikin Ashi Close) ÷ 2)
- High Price → Maximum of ((High, Heikin Ashi Open, Heikin Ashi Close))
- Low Price → Minimum of ((Low, Heikin Ashi Open, Heikin Ashi Close))
This formula smooths price action, making trends easier to spot and reducing the impact of short-term volatility.
Distinctive Features
The Heikin Ashi Indicator offers several unique qualities:
- Noise Reduction → Filters out minor fluctuations for clearer visualization.
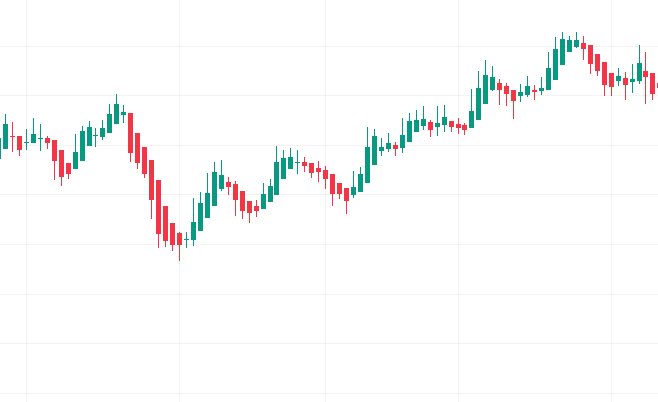
- Trend Clarity → Long green candles indicate strong bullish trends; long red candles indicate strong bearish trends.
- Reversal Signals → Small-bodied candles with long wicks suggest potential turning points.
- Versatility → Works across multiple timeframes and asset classes.
- Visual Simplicity → Easier to interpret than traditional candlesticks in volatile markets.
Benefits for Traders
The indicator provides practical advantages in trading analysis:
- Trend Identification → Offers a clearer view of ongoing bullish or bearish momentum.
- Disciplined Entries & Exits → Helps traders stay in trends longer and exit when reversal signals appear.
- Risk Control → Reduces false signals, improving trade discipline.
- Reversal Awareness → Highlights weakening trends through smaller candles and shadows.
- Analytical Synergy → Works well with moving averages, RSI, or MACD for layered confirmation.
Why It Matters
Heikin Ashi is more than just a charting technique—it is a trend visualization framework. By smoothing price data, it allows traders to ride trends longer, avoid premature exits, and gain confidence in their analysis. Its simplicity makes it accessible to beginners, while its effectiveness ensures it remains valuable for advanced strategies.
Conclusion
The Heikin Ashi Indicator simplifies trend analysis by filtering noise and highlighting genuine momentum. Its ability to provide clearer visualization of bullish and bearish phases makes it especially useful for swing traders and trend followers. While best used in combination with other indicators, Heikin Ashi offers a structured framework for navigating dynamic markets with precision. For traders seeking to refine entries, exits, and risk management, Heikin Ashi delivers clarity and confidence.