
The Negative Volume Index (NVI) is a volume‑based technical indicator designed to highlight market behavior during sessions of declining trading activity. Originally introduced by Paul Dysart and later refined by Norman Fosback, NVI operates on the principle that institutional investors—often referred to as “smart money”—tend to act during quieter, low‑volume days. By tracking price changes only when volume contracts, NVI provides a unique perspective on hidden accumulation or distribution phases that may not be visible in traditional price analysis.
Structural Components
The NVI calculation follows a selective update process:
- Volume Comparison: Identify days when current volume is lower than the previous session.
- Price Adjustment: On those days, NVI is updated based on the percentage change in price.
[ NVI_t = NVI_{t-1} + {(Price_t – Price_{t-1})}/{Price_{t-1}} * NVI_{t-1} ] - No Update on Rising Volume Days: If volume increases, NVI remains unchanged.
- Signal Line Overlay: A long‑term moving average (commonly 255‑day) is often plotted alongside NVI to generate crossover signals.
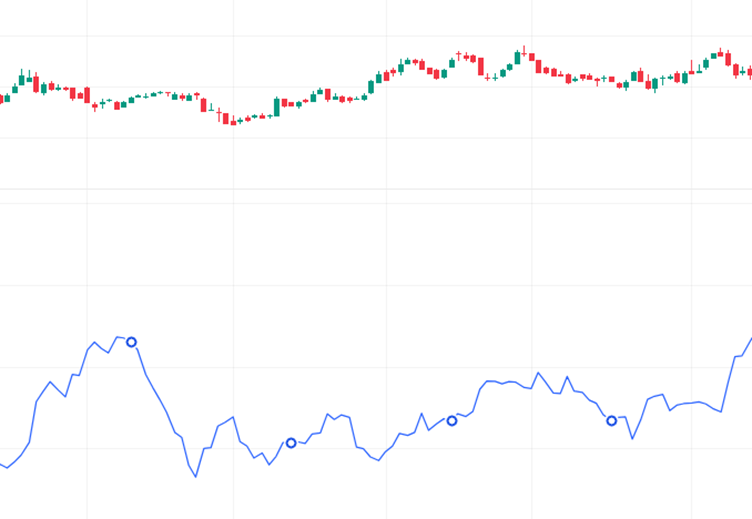
This cumulative calculation produces a line that reflects price behavior specifically during low‑volume sessions.
Distinctive Attributes
- Low‑Volume Sensitivity: Focuses exclusively on quieter trading days.
- Institutional Insight: Assumes professional investors act during periods of reduced crowd activity.
- Trend Confirmation: Rising NVI suggests accumulation; falling NVI signals distribution.
- Crossover Utility: NVI crossing above its moving average is interpreted as bullish, while crossing below is bearish.
- Cross‑Market Application: Effective across equities, forex, commodities, and cryptocurrencies.
Market Psychology Reflected
- Rising NVI Line: Indicates accumulation by institutional players during quieter sessions.
- Declining NVI Line: Suggests distribution or selling pressure from smart money.
- Flat NVI: Reflects indecision or lack of institutional participation.
- Crossover Signals: Capture shifts in sentiment when NVI moves relative to its long‑term average.
This dynamic mirrors how traders interpret hidden accumulation or distribution phases, offering a structured view of underlying conviction.
Contextual Importance
- Trend Validation: Confirms whether institutional investors support prevailing direction.
- Reversal Alerts: Divergence between NVI and price can signal weakening momentum.
- Noise Filtering: Focuses on quieter sessions, reducing false signals.
- Decision Support: Provides a structured benchmark for interpreting smart money behavior.
Final Insight
The Negative Volume Index (NVI) is a distinctive volume‑based indicator that emphasizes price action during low‑volume days. By focusing on institutional activity, it helps traders and investors identify accumulation, distribution, and potential reversals. With its ability to highlight hidden market strength, NVI remains a valuable tool for anticipating shifts in sentiment. When combined with complementary indicators such as OBV, RSI, or MACD, NVI enhances accuracy and confidence, offering a disciplined framework to interpret bullish and bearish conditions across multiple financial markets.