
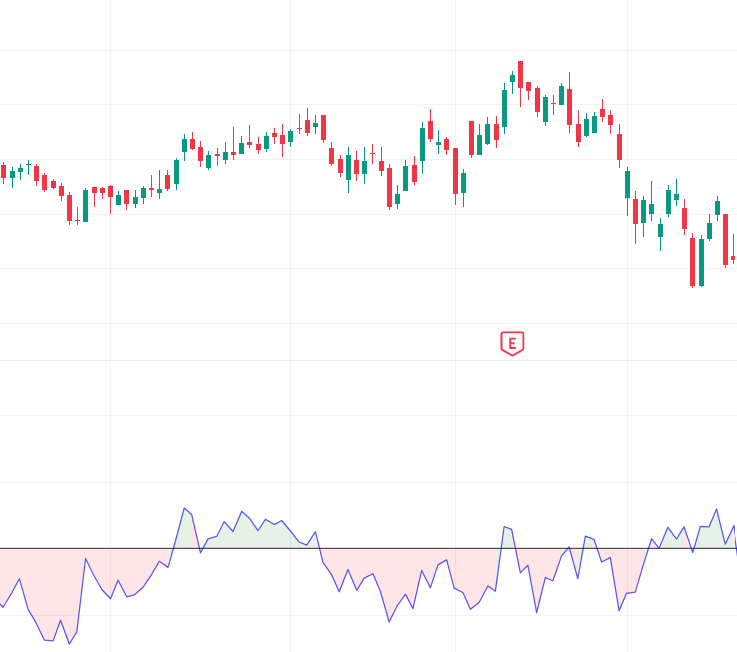
The QStick Indicator is a momentum and sentiment analysis tool that evaluates the relationship between opening and closing prices over a chosen period. Its foundation lies in candlestick behavior: when markets close above their opening price, it reflects bullish pressure, while closes below the open highlight bearish sentiment. Unlike complex oscillators, QStick is straightforward, focusing directly on candlestick dynamics to reveal underlying market psychology.
Interpolation enhancements further refine the indicator, reducing erratic fluctuations and providing smoother visualization. This makes QStick especially useful in volatile markets where raw candlestick data can appear noisy.
Structural Components
The QStick formula is based on the moving average of the difference between closing and opening prices:
QStick = MA(Close – Open)
- Positive Values: Indicate bullish dominance.
- Negative Values: Suggest bearish control.
- Interpolation Smoothing: Improves consistency and reduces random spikes.
This simple yet effective structure allows traders to quickly assess sentiment shifts.
Distinctive Attributes
- Candlestick Sentiment Measurement: Captures buying and selling pressure directly from open‑close dynamics.
- Straightforward Interpretation: Positive readings = bullish bias; negative readings = bearish bias.
- Noise Filtering: Interpolation reduces misleading short‑term volatility.
- Trend Confirmation: Supports broader price action analysis.
- Momentum Detection: Highlights strengthening or weakening sentiment.
- Cross‑Market Utility: Applicable across equities, forex, commodities, and cryptocurrencies.
Market Psychology Reflected
- Sustained Positive QStick: Indicates strong buyer conviction and optimism.
- Persistent Negative QStick: Reflects selling pressure and bearish sentiment.
- Neutral or Flat Readings: Suggest indecision or consolidation phases.
- Smooth Transitions: Prevent traders from overreacting to temporary volatility spikes.
This dynamic mirrors crowd behavior, offering insight into how traders collectively respond to market conditions.
Analytical Considerations
- QStick is sentiment‑sensitive, making it effective for confirming candlestick‑based momentum.
- It is often paired with moving averages, RSI, or MACD for stronger validation.
- Particularly useful for swing traders and longer‑term analysts, who rely on sentiment confirmation.
- Customizable parameters allow adaptation to different timeframes and asset classes.
Contextual Importance
- Market Pressure Evaluation: Identifies whether buyers or sellers dominate.
- Momentum Confirmation: Validates strength behind price moves.
- Noise Filtering: Provides smoother signals that reduce false entries.
- Decision Support: Enhances confidence by offering clearer visualization of sentiment.
Final Insight
The QStick Indicator is a practical and effective sentiment tool that translates candlestick behavior into measurable signals. Its simplicity, combined with interpolation smoothing, makes it reliable for identifying bullish and bearish pressure across multiple markets. By filtering noise and highlighting meaningful sentiment shifts, QStick provides traders with a structured framework to interpret market psychology and improve clarity in momentum analysis.