
The Takuri candlestick formation is a distinctive single‑candle pattern that signals potential bullish reversal. Closely resembling a hammer, it is defined by its exceptionally long lower shadow, which reflects aggressive selling pressure that ultimately fails as buyers regain control.
Candle Anatomy
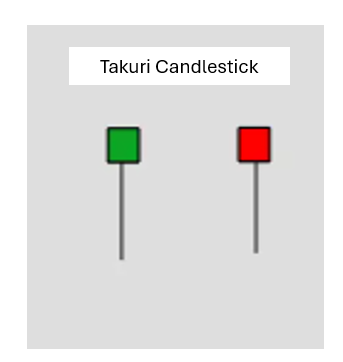
- Body: Small, positioned near the top of the trading range, showing that the open and close are close together.
- Lower Shadow: Extremely long, often three times the size of the body, highlighting strong downward movement during the session.
- Upper Shadow: Minimal or absent, emphasizing that buyers managed to hold prices near the top by the close.
Distinctive Attributes
- Typically appears after a downtrend, making it a potential bottoming signal.
- The long lower shadow is the defining feature, showing sellers attempted to push prices sharply lower.
- The small body near the top reflects buyer recovery and regained control.
- Gains credibility when followed by a bullish candle in the next session.
Sentiment Dynamics
- Seller Aggression Early: Prices drop significantly as sellers dominate the initial part of the session.
- Buyer Counterattack: Buyers step in strongly, pulling prices back upward.
- Psychological Shift: The long lower shadow reflects the failed attempt of sellers to maintain control, signaling exhaustion.
This sequence illustrates how the Takuri captures the transition from pessimism to optimism, paving the way for renewed bullish sentiment.
Analytical Considerations
- The Takuri is rare, requiring precise shadow‑to‑body proportions.
- Without confirmation, it may represent only short‑term volatility rather than a true reversal.
- Best interpreted when paired with momentum indicators (RSI, MACD), moving averages, or volume analysis to validate the setup.
Contextual Importance
- At Market Bottoms: Acts as a warning that selling pressure may be fading.
- During Extended Declines: Serves as a sign that buyers are beginning to resist further losses.
- Volume Confirmation: Heavy trading activity during the following bullish candle adds credibility to the reversal signal.
Final Insight
The Takuri candlestick pattern is a powerful bullish reversal indicator, marked by its distinctive long lower shadow and small body near the top. Its rarity makes it significant, and when confirmed by subsequent bullish price action or supporting indicators, it provides traders with confidence to anticipate recoveries. Recognizing this formation at the bottom of a downtrend allows market participants to prepare for potential rallies and manage risk more effectively, making it a valuable addition to advanced candlestick analysis.