
The Relative Strength (RS) indicator is a momentum‑based tool that evaluates how one asset performs relative to another, a benchmark index, or the overall market. Unlike oscillators that focus on overbought or oversold conditions, RS emphasizes comparative performance, making it a cornerstone of portfolio rotation, sector analysis, and institutional capital allocation.
By highlighting outperforming and underperforming assets, RS helps traders and investors identify market leaders during bullish phases and spot weak instruments during bearish conditions. Interpolation enhancements further refine the indicator, reducing noise and improving readability.
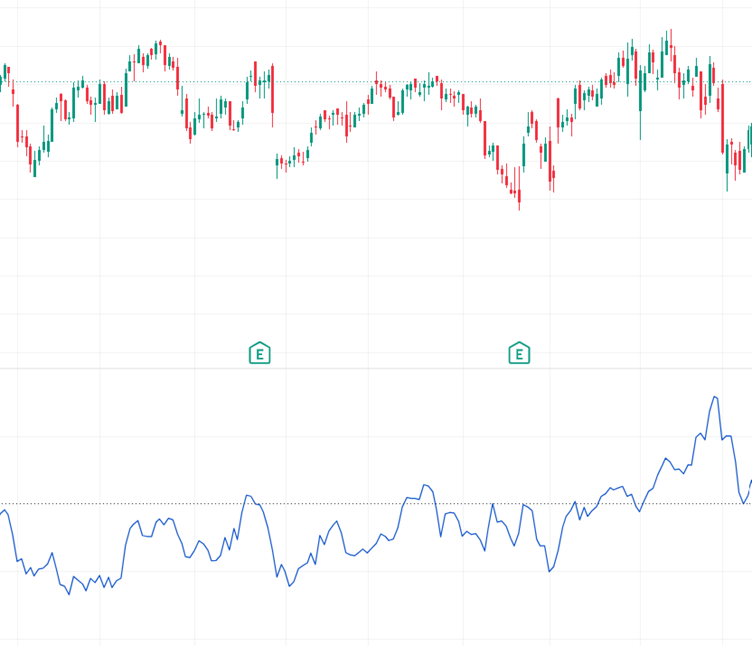
Structural Components
Relative Strength is calculated as a ratio between two price series:
RS = {Price of Asset}{Price of Benchmark}
- Rising Ratio: Indicates the asset is outperforming the benchmark.
- Falling Ratio: Suggests underperformance relative to the benchmark.
- Smoothing Techniques: Moving averages and interpolation reduce erratic fluctuations.
- Advanced Versions: May include signal lines, divergence detection, and color‑coded zones for easier interpretation.
Distinctive Attributes
- Comparative Market Evaluation: Assesses performance against indexes, sectors, or currencies.
- Trend Confirmation: A rising RS line validates bullish leadership.
- Sector Rotation Insight: Reveals where institutional money is flowing.
- Noise Filtering: Interpolation reduces random spikes.
- Multi‑Timeframe Utility: Effective across intraday, swing, and long‑term horizons.
- Divergence Detection: Highlights weakening momentum when price rises but RS falls.
Market Psychology Reflected
- Outperforming Assets: Attract investor confidence and institutional participation.
- Underperforming Assets: Signal weakness, often avoided during capital rotation.
- Stable RS Readings: Suggest balanced sentiment and consolidation.
- Divergence Patterns: Reveal hesitation when price continues upward but RS fails to confirm strength.
This dynamic captures how traders and institutions perceive leadership and weakness in markets, offering a lens into crowd behavior.
Analytical Considerations
- RS is performance‑sensitive, making it effective for identifying market leaders.
- It is often paired with RSI, MACD, or moving averages to confirm signals.
- Particularly useful for portfolio managers and sector analysts, who rely on comparative strength for capital allocation.
- Customizable parameters allow adaptation to different benchmarks and timeframes.
Contextual Importance
- Leadership Identification: Pinpoints assets outperforming peers or benchmarks.
- Risk Management: Avoids weaker instruments during uncertain conditions.
- Momentum Confirmation: Validates whether strength is supported by comparative performance.
- Decision Support: Provides structured analysis, reducing reliance on speculation or news.
Final Insight
The Relative Strength Indicator is a powerful comparative performance tool that helps traders and investors focus on stronger opportunities while avoiding weaker assets. Its ability to highlight market leadership, confirm momentum, and detect divergences makes it indispensable across equities, forex, commodities, and cryptocurrencies. With interpolation smoothing improving clarity, RS enhances confidence and precision, offering a robust framework for portfolio rotation and trend analysis.