
The Bearish Harami Cross is a refined variation of the traditional Bearish Harami pattern. Instead of a smaller bearish candle appearing within the body of a larger bullish candle, the second candle is a Doji a session where the open and close prices are nearly identical. This unique structure introduces indecision into the market, signalling that the prior bullish momentum may be weakening and that sellers could be preparing to step in.
Candle Arrangement
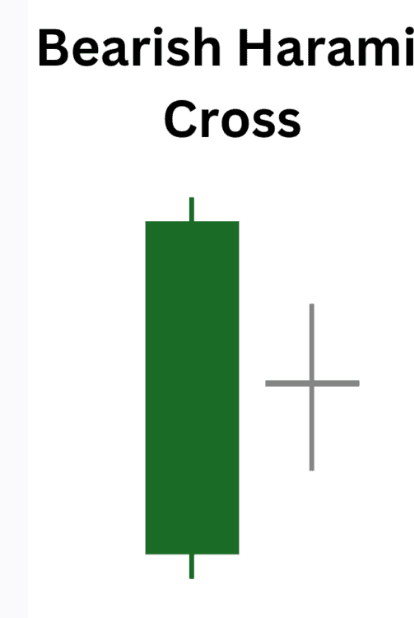
- First Candle – Buyer Strength: A long bullish candle continues the prevailing rally, reflecting strong upward momentum and confidence among buyers.
- Second Candle – Doji Pause: A Doji forms entirely within the body of the first candle, showing hesitation as neither buyers nor sellers establish clear dominance.
This containment, combined with the Doji’s neutrality, highlights a market that is stalling after a strong advance.
Distinctive Attributes
- Typically appears after a prolonged rally or extended bullish phase.
- The Doji candle is the defining feature, representing indecision and loss of buyer conviction.
- The signal gains credibility when confirmed by subsequent bearish candles or increased trading volume.
- Most effective when it forms near resistance levels, where buying enthusiasm often fades.
Sentiment Dynamics
- Phase One – Optimism Continues: Buyers dominate, pushing prices higher with conviction.
- Phase Two – Market Hesitation: The Doji introduces uncertainty, as neither side gains control.
- Interpretation: Traders view this pause as a potential warning that bullish strength is fading. If sellers step in afterward, the pattern can mark the beginning of a downturn.
In essence, the Bearish Harami Cross represents a market “catching its breath,” where buying pressure eases and selling interest quietly emerges.
Analytical Considerations
- The Bearish Harami Cross is a subtle reversal signal, weaker than patterns like the Bearish Engulfing.
- It may sometimes indicate consolidation rather than a full reversal, especially in sideways markets.
- False signals are possible without confirmation, so traders often pair it with momentum indicators (RSI, MACD), moving averages, or volume analysis.
Contextual Importance
- Near Resistance Zones: The pattern is most effective when it appears close to resistance levels, where buying enthusiasm typically diminishes.
- Volume Confirmation: A spike in trading activity during or after the Doji strengthens the reliability of the signal.
- Follow‑Up Candles: Subsequent bearish sessions often validate the reversal, turning hesitation into downward momentum.
Final Insight
The Bearish Harami Cross is a subtle but significant variation of the Harami family. While not the strongest reversal signal, its unique combination of a bullish candle followed by a Doji provides traders with an early indication that sentiment may be shifting. Recognizing this formation at the top of an uptrend and confirming it with supporting indicators allows traders to anticipate downturns and prepare for emerging risks.
Ultimately, the Bearish Harami Cross reminds us that indecision itself can be meaningful. A single Doji, when contained within the body of a larger bullish candle, can serve as a quiet but important signal that the tide may be turning.