
The Bearish Harami candlestick formation is a modest yet meaningful reversal signal that often appears at the peak of a bullish phase. Its name, derived from the Japanese word Harami meaning “pregnant,” reflects the imagery of a smaller candle contained within a larger one. This visual arrangement captures hesitation in the market, hinting that strong buying enthusiasm may be losing steam and that sellers are beginning to test their strength.
Candle Arrangement
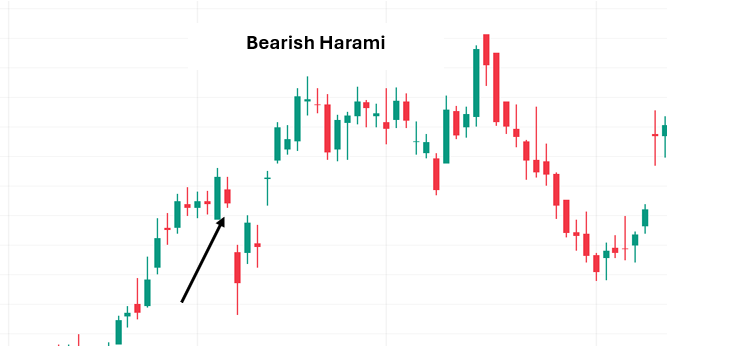
- First Candle – Buyer Control: A long bullish candle continues the prevailing rally, showing strong upward momentum and confidence among buyers.
- Second Candle – Seller Emergence: A smaller bearish candle forms entirely within the body of the first, signaling hesitation and the cautious entry of sellers.
This containment is the defining trait of the Harami, visually representing a pause in bullish dominance.
Distinctive Attributes
- Typically forms after a sustained rally or extended bullish trend.
- The second candle’s body is smaller and fully enclosed within the first.
- The signal gains credibility when supported by higher trading volume or confirmed by subsequent bearish candles.
Sentiment Dynamics
- Phase One – Optimism Continues: Buyers dominate, pushing prices higher with conviction.
- Phase Two – Market Hesitation: The smaller bearish candle reflects uncertainty, as sellers cautiously step in to limit further gains.
- Interpretation: This transition highlights weakening bullish momentum and the potential start of distribution, where sellers begin to prepare for a possible downward move.
In essence, the Bearish Harami represents a market “catching its breath,” where buying pressure eases and selling interest quietly emerges.
Analytical Considerations
- The Bearish Harami is a weaker reversal signal compared to stronger formations like the Bearish Engulfing.
- It may indicate consolidation rather than a full reversal, particularly in sideways markets.
- Traders often combine it with trendlines, momentum indicators (RSI, MACD), or volume analysis to improve reliability.
Contextual Importance
- Near Resistance Zones: The pattern is most effective when it appears close to resistance levels, where buying enthusiasm typically fades.
- Volume Confirmation: Heavy trading volume during or after the Harami strengthens its credibility.
- Follow‑Up Candles: Subsequent bearish price action often validates the signal, turning hesitation into a confirmed reversal.
Final Insight
The Bearish Harami is a subtle but valuable signal of potential trend change. While not as forceful as other bearish patterns, it provides traders with an early indication that sentiment may be shifting. Recognizing this formation after a rally and pairing it with supporting indicators allows traders to anticipate downturns and adjust strategies with confidence.
Ultimately, the Bearish Harami reminds us that even small candles can carry significant meaning. It is a quiet but important signal that strong rallies can falter, offering traders a chance to prepare for market shifts before more decisive patterns appear.