
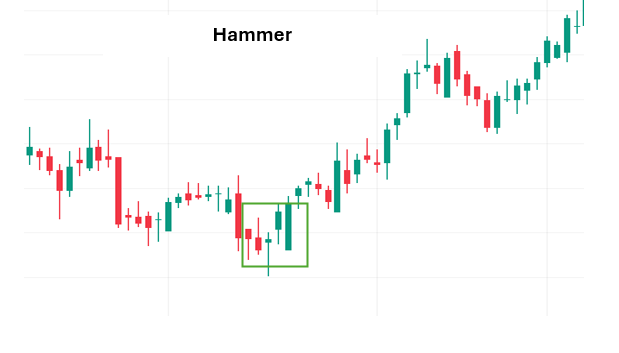
The Hammer candlestick formation is one of the most recognizable single‑candle patterns in technical analysis. It often appears after a decline and serves as an early indication that bearish momentum may be weakening. Its distinctive shape — a small body near the top of the range with a long lower shadow — makes it easy to spot and interpret.
Candle Anatomy
- Body: Small and positioned near the top of the candle’s range, showing that the open and close are nearly aligned.
- Upper Shadow: Minimal or absent, reinforcing that buyers managed to close the session near the high.
- Lower Shadow: Long and pronounced, usually at least twice the size of the body, reflecting rejection of lower prices.
- Appearance: Resembles a hammer, with the body as the head and the long lower wick as the handle.
Distinctive Attributes
- Typically forms after a downtrend or extended selling pressure, making it a potential reversal marker.
- The long lower shadow demonstrates that buyers stepped in aggressively after sellers pushed prices down.
- Gains credibility when followed by a bullish candle in the next session or supported by strong trading volume.
Sentiment Dynamics
- Seller Control Early: Prices drop sharply as sellers dominate the initial part of the session.
- Buyer Recovery: Buyers regain strength, pushing prices back to the opening level.
- Psychological Shift: This tug‑of‑war signals exhaustion of bearish momentum and renewed optimism among buyers.
The Hammer captures the transition from pessimism to hesitation, and finally to renewed bullish sentiment.
Analytical Considerations
- The Hammer is common, but not every occurrence signals reversal.
- Without confirmation, it may represent only short‑term indecision rather than a true trend change.
- Best interpreted when paired with momentum indicators (RSI, MACD), moving averages, or volume analysis to validate the setup.
Contextual Importance
- At Market Bottoms: Acts as a warning that selling pressure may be fading.
- During Extended Declines: Serves as a sign that buyers are beginning to resist further losses.
- Volume Confirmation: Heavy trading activity during the Hammer session adds credibility to the reversal signal.
Final Insight
The Hammer candlestick pattern is a subtle yet powerful bullish reversal indicator. Its long lower shadow reflects strong rejection of lower prices, and when confirmed by subsequent bullish action, it provides traders with confidence to anticipate market turnarounds. Recognizing this formation at the bottom of a downtrend allows market participants to prepare for recoveries and manage risk more effectively, making it a valuable addition to advanced candlestick analysis.