
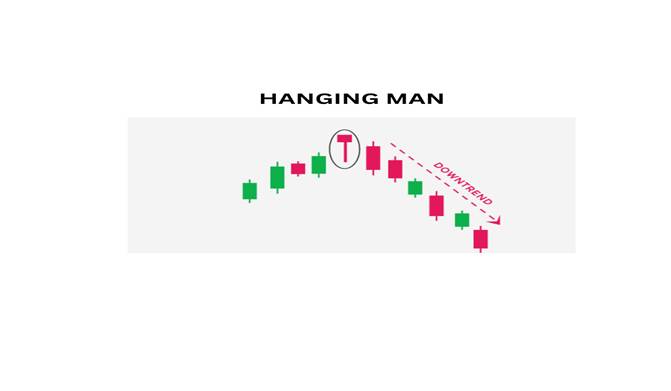
The Hanging Man candlestick formation is a single‑candle pattern that resembles the Hammer but appears at the top of an uptrend. Its unique structure signals potential weakness in bullish momentum, even though buyers manage to close the session near the high.
Candle Anatomy
- Body: Small and positioned near the top of the range, showing that the open and close are close together.
- Upper Shadow: Minimal or absent, reinforcing that buyers closed the session near the high.
- Lower Shadow: Long and pronounced, at least twice the size of the body, reflecting strong selling pressure during the session.
- Appearance: Visually resembles a “hanging man,” symbolizing vulnerability at the peak of a rally.
Distinctive Attributes
- Typically forms after a prolonged rally or strong bullish move, making it a potential reversal marker.
- The long lower shadow demonstrates that sellers tested lower prices during the session.
- Gains credibility when followed by a bearish candle in the next session or supported by strong trading volume.
Sentiment Dynamics
- Buyer Control Early: Prices rise as buyers dominate the initial part of the session.
- Seller Pushback: Sellers step in, driving prices down significantly during the session.
- Buyer Recovery: Buyers regain ground, but the long lower wick reveals hidden selling pressure.
- Psychological Shift: This tug‑of‑war signals weakening bullish momentum and potential exhaustion.
The Hanging Man captures the transition from optimism to caution, highlighting that sellers are beginning to challenge buyer dominance.
Analytical Considerations
- The Hanging Man is common, but not every occurrence signals reversal.
- Without confirmation, it may represent only short‑term indecision rather than a true trend change.
- Best interpreted when paired with momentum indicators (RSI, MACD), moving averages, or volume analysis to validate the setup.
Contextual Importance
- At Market Tops: Acts as a warning that bullish enthusiasm may be fading.
- During Extended Rallies: Serves as a sign that buyers are losing conviction.
- Volume Confirmation: Heavy trading activity during the Hanging Man session adds credibility to the reversal signal.
Final Insight
The Hanging Man candlestick pattern is a subtle yet important bearish reversal indicator. Its long lower shadow reflects underlying selling pressure, and when confirmed by subsequent bearish action, it provides traders with confidence to anticipate downturns. Recognizing this formation at the top of an uptrend allows market participants to prepare for potential declines and manage risk more effectively, making it a valuable addition to advanced candlestick analysis.