
Introduction
The Ichimoku Kinko Hyo, often referred to as the Ichimoku Cloud, is a comprehensive technical analysis system created by Goichi Hosoda in the late 1930s. Unlike single-line indicators, Ichimoku provides a holistic view of market conditions by combining trend, momentum, and support/resistance into one chart. Its versatility has made it a staple in forex, equities, and commodities trading, offering traders insights into both short-term fluctuations and long-term directional bias.
Structural Framework
The Ichimoku system is composed of five distinct elements:
- Tenkan-sen (Conversion Line) → ((9\text{-period high} + 9\text{-period low}) ÷ 2)
- Kijun-sen (Base Line) → ((26\text{-period high} + 26\text{-period low}) ÷ 2)
- Senkou Span A (Leading Span A) → ((Tenkan-sen + Kijun-sen) ÷ 2), plotted 26 periods ahead
- Senkou Span B (Leading Span B) → ((52\text{-period high} + 52\text{-period low}) ÷ 2), plotted 26 periods ahead
- Chikou Span (Lagging Span) → Current closing price plotted 26 periods behind
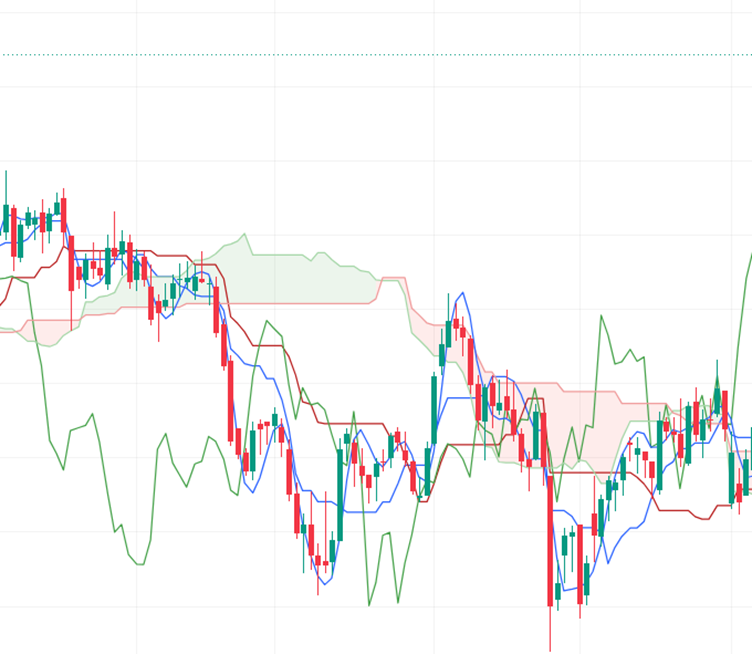
The shaded area between Senkou Span A and Senkou Span B forms the Cloud (Kumo), which acts as a dynamic zone of support and resistance.
Distinctive Features
The Ichimoku Cloud offers several unique qualities:
- Trend Identification → Cloud thickness and position highlight bullish or bearish phases.
- Momentum Signals → Crossovers between Tenkan-sen and Kijun-sen generate buy/sell triggers.
- Support & Resistance → The cloud acts as a forward-looking zone where price reacts.
- Projection Ability → Leading spans extend support/resistance into the future.
- Versatility → Applicable across multiple timeframes and asset classes.
Benefits for Traders
The indicator provides actionable insights in trading scenarios:
- Clear Trend Visualization → Price above the cloud signals bullish sentiment, while price below indicates bearish bias.
- Disciplined Entries & Exits → Tenkan-sen/Kijun-sen crossovers provide structured trade signals.
- Risk Management → Cloud zones help set stop-loss levels and avoid false breakouts.
- Reversal Awareness → Thin clouds or price breaking through the cloud often signal potential trend changes.
- Analytical Synergy → Works effectively with oscillators like RSI or MACD for layered confirmation.
Why It Matters
The Ichimoku Cloud is more than just an indicator—it is a complete trading system. By combining multiple elements into one chart, it allows traders to evaluate market conditions at a glance. Its forward-looking nature makes it particularly valuable for anticipating future support and resistance, helping traders stay ahead of potential reversals.
Conclusion
The Ichimoku Kinko Hyo provides a multi-dimensional framework that integrates trend, momentum, and support/resistance into a single chart. Its unique cloud structure offers forward-looking insights, making it one of the most versatile tools in technical analysis. While it may seem complex initially, traders who master Ichimoku gain a powerful system for disciplined decision-making. For those seeking to anticipate trends, manage risk, and refine entries/exits, the Ichimoku Cloud delivers a comprehensive solution to navigate bullish and bearish markets with confidence.